The Open Observatory of Network Interference (OONI) is a non-profit free software project that empowers decentralized efforts in documenting internet censorship worldwide. OONI provides free software tools for users to test their internet connection quality, detect censorship, and measure network interference. These tests can reveal blocked or restricted websites, apps, or services and help identify technical censorship methods.
OONI uses ClickHouse for handling large volumes of data, as its data storage and analytics engine. ClickHouse enables OONI to perform complex queries on the vast amounts of data collected through its network measurement tests. It also supports generating visualizations, which aid in identifying trends and patterns in the data.
OONI's Mission and Global Impact
OONI was established more than ten years ago to increase transparency about internet censorship worldwide. One of their tools, OONI Probe, allows users to run network experiments to determine which websites, instant messaging apps, and circumvention tools are restricted on their network.
OONI collects the data generated by its global network of volunteers, analyzes it, publishes it as open data, and produces research that contextualizes the findings within specific countries, regions, and ongoing social or political events. The organization also collaborates with 43 partner organizations worldwide to disseminate findings, conduct advocacy, and support policymaking and legal actions.
From PostgreSQL to ClickHouse: Improving Performance and Simplifying Architecture
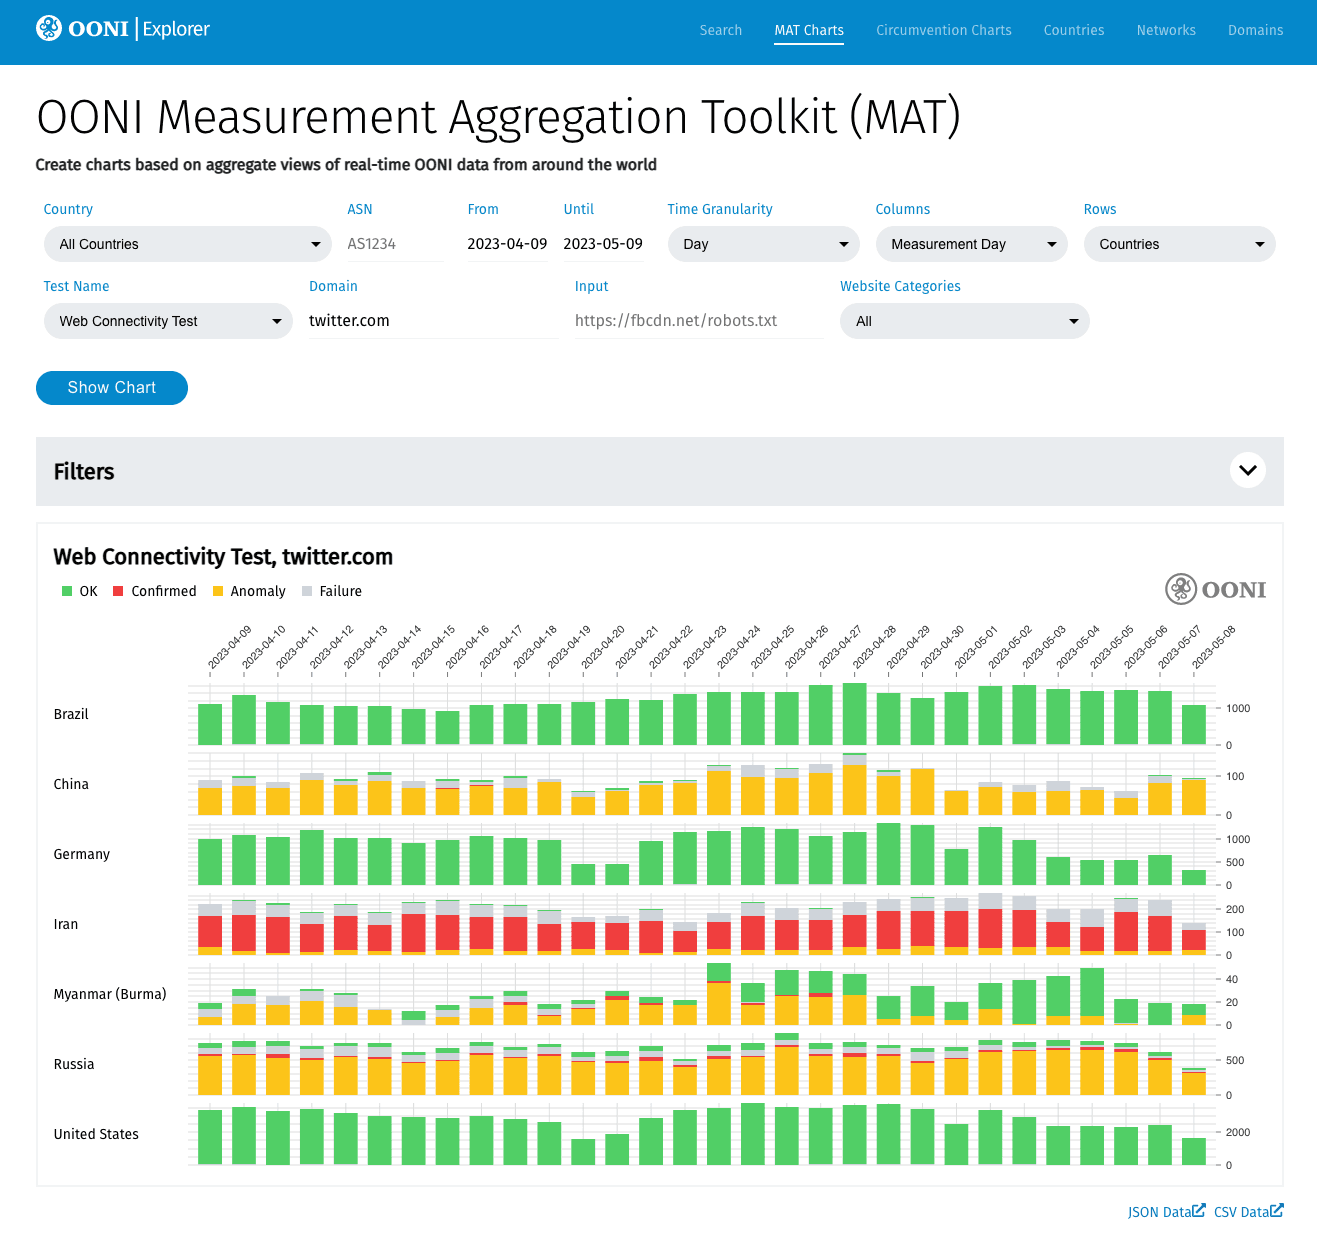 OONI Measurement Aggregation Toolkit (MAT) showing the blocking of twitter.com in China, Iran, Myanmar and Russia (view dashboard).
OONI Explorer is an open data platform that allows users to explore the collected data and understand the technical means by which censorship is implemented. They needed a solution that could simplify their architecture while handling complex data visualizations and enabling searches and aggregations on their 1B+ row dataset.
Before ClickHouse, OONI used flat files, MongoDB, and PostgreSQL to store metadata from measurement experiments. However, they faced performance problems due to their massive dataset. As the dataset grew into hundreds of millions of rows, performance issues arose, requiring moving from an OLTP database to an OLAP one.
The Data Pipeline: Integrating ClickHouse into OONI's Workflow
ClickHouse streamlined OONI's architecture, allowing easier data access for researchers. Lead Developer at OONI, Arturo Filastò, stated, "The ability to simplify our architecture with just one master table allowed us to iterate faster and run any query directly on the dataset." Filastò also noted that ClickHouse's efficiency significantly improved their investigations. "Having all the data in ClickHouse means we can quickly answer questions without having to wait hours for queries to converge, significantly improving our internal data analysis tasks."
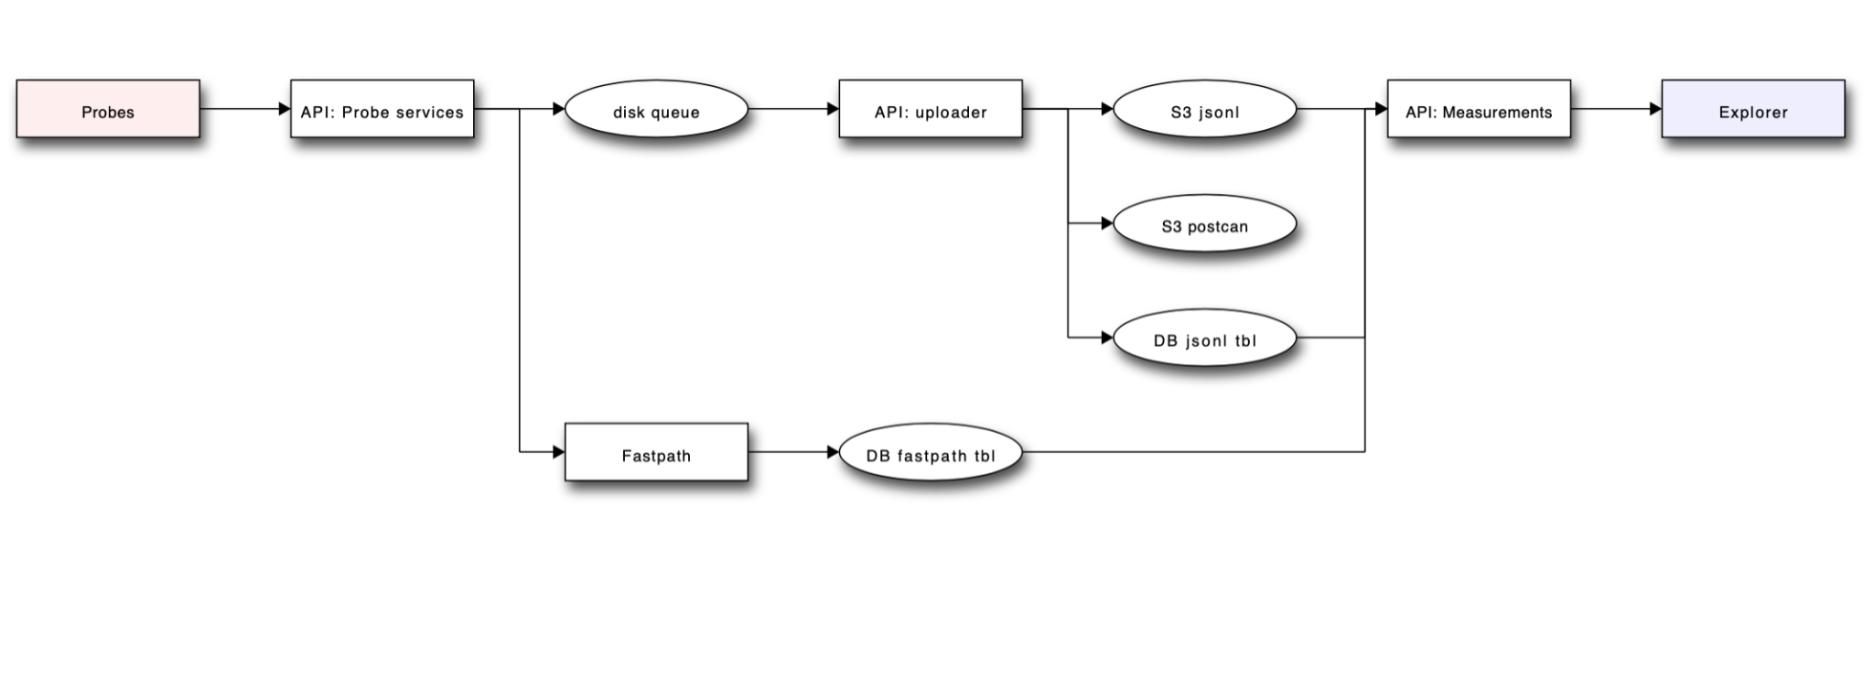 The architecture of OONI's data pipeline involves probes running on users' devices, which periodically carry out measurements and upload the results to OONI's measurement collection API.
Raw data (compressed JSON files) is stored on S3, while the metadata is stored in a single large table. This table contains all the relevant metadata for analysis and aggregation, such as country, network, timestamp, target, and the outcome of the analysis. The schema of this large table is the following:
    CREATE TABLE fastpath
    (
        `measurement_uid` String,
        `report_id` String,
        `input` String,
        `probe_cc` String,
        `probe_asn` Int32,
        `test_name` String,
        `test_start_time` DateTime,
        `measurement_start_time` DateTime,
        `filename` String,
        `scores` String,
        `platform` String,
        `anomaly` String,
        `confirmed` String,
        `msm_failure` String,
        `domain` String,
        `software_name` String,
        `software_version` String,
        `control_failure` String,
        `blocking_general` Float32,
        `blocking_type` String,
        `test_version` String,
        `test_runtime` Float32,
        `architecture` String,
        `engine_name` String,
        `engine_version` String
    )
    ENGINE = ReplacingMergeTree
    ORDER BY (measurement_start_time, report_id, input)
    SETTINGS index_granularity = 8192;
With a size of 1.4 billion records and 32 columns, it is used in many aggregation queries that power the OONI Measurement Aggregation Toolkit (MAT) and their internal data analysis tools. The aggregation queries run on the dataset are built based on user configurable parameters and at a high level have the following structure:
SELECT
countIf(anomaly = 't' AND confirmed = 'f' AND msm_failure = 'f') AS anomaly_count,
countIf(confirmed = 't' AND msm_failure = 'f') AS confirmed_count,
countIf(msm_failure = 't') AS failure_count,
countIf(anomaly = 'f' AND confirmed = 'f' AND msm_failure = 'f') AS ok_count,
COUNT(*) AS measurement_count,
[user configured grouping parameter_a],
[user configured grouping parameter_b]
WHERE
[user configured filter]
GROUP BY [user configured grouping parameter_a], [user configured grouping parameter_b]
Here is a more practical example that readers can try. The following visualization on OONI's UI produces the query written below - https://explorer.ooni.org/chart/mat?test_name=web_connectivity&axis_x=measurement_start_day&since=2023-04-12&until=2023-05-12&time_grain=day
SELECT
	countIf (anomaly = 't' AND confirmed = 'f'
    	AND msm_failure = 'f') AS anomaly_count,
	countIf (confirmed = 't' AND msm_failure = 'f') AS confirmed_count,
	countIf (msm_failure = 't') AS failure_count,
	countIf (anomaly = 'f'	AND confirmed = 'f'
    	AND msm_failure = 'f') AS ok_count,
	COUNT(*) AS measurement_count,
	toDate (measurement_start_time) AS measurement_start_day
FROM	fastpath
WHERE
	measurement_start_time >= '2023-04-12 00:00:00'
	AND measurement_start_time < '2023-05-12 00:00:00'
	AND test_name IN ['web_connectivity']
GROUP BY	measurement_start_day
ORDER BY	measurement_start_day
This query scanned approximately 59 million rows in 600 milliseconds.
By switching to ClickHouse they saw that certain heavy queries that used to take up to 20 minutes to run on PostgreSQL, only take hundreds of milliseconds in ClickHouse. They also saw a 2x reduction in on-disk size for the database.
When using PostgreSQL for their experiments' metadata storage, they faced performance issues while building the MAT and couldn't query SQL tables directly for aggregations. To overcome this, they used counter tables with pre-computed counts, but this approach remained complex and inefficient. ClickHouse enabled them to perform aggregations directly on the dataset without maintaining intermediate counter representations, simplifying the data pipeline.
With ClickHouse, OONI improved its architecture for faster data access and analysis. This allowed real-time publication of measurements, aiding human rights defenders in rapidly responding to censorship events around the world.
Learn more: https://ooni.org/