You’ve probably heard of Flight Radar, the Real-Time Flight Tracker Map, and had a lot of fun following aircraft around the sky, but in this blog post, we’ll introduce you to something even cooler!!
ADS-B (Automatic Dependent Surveillance-Broadcast) is a radio protocol used to broadcast various flight data. Our co founder and CTO Alexey Milovidov has built an interactive visualization and analytics tool on this data. If nothing else, he's invented an entirely new art form in the process!

This website aggregates and visualizes massive amounts of air traffic data. The data is hosted in a ClickHouse database and queried on the fly. You can tune the visualizations with custom SQL queries and drill down from 50 billion records to individual data records. The result is some pretty spectacular imagery!
While this blog post mainly focuses on how the demo was built, feel free to skip to the end for some jaw-dropping visuals.
Alternatively, visit https://adsb.exposed, find the visual for your local city, and share it on social media! We’re offering a ClickHouse T-shirt to the most beautiful image, and the winner will be announced on our next community call on 30th April.
The full source code for this demo can be found here.
How do you get ADS-B data?
ADS-B is broadcast by "transponders" installed on airplanes (and not only planes). This protocol is unencrypted, and there are no restrictions on collecting, using, or redistributing this data. Most passenger airplanes are obligated to broadcast this data, and even gliders, drones, and airport ground vehicles in certain countries. Military and private light aircraft might or may not broadcast.
It is possible to collect this data out of thin air using your own radio receiver (e.g., in the form of SDR), although your receiver will see the data only in a specific range of your location. There are platforms for sharing and exchange of this data. Some platforms invite participants to share the data but restrict its redistribution by providing commercial access. While the source data, broadcast by airplanes, is essentially public domain, the companies may produce and license derivative works from this data.
We use the data from two sources: ADSB.lol (complete historical data is provided without restrictions: 30 to 50 million records per day, available since 2023 under the Open Database License) and ADSB-Exchange (only provides samples of data from the first day of each month: around 1.2 billion records per day with better coverage).
Another promising data source, airplanes.live, has been brought to our attention. The author offered to provide historical and real-time data for non-commercial usage. It has great coverage and data quality, and we are going to include it in the following days.
Implementation Details
The website is implemented as a single HTML page. It does not use JavaScript frameworks, and the source code is not minified, so it is easy to read.
Rendering the Map
The Leaflet library is used to display the map in two layers. The background layer uses tiles from OpenStreetMap to create a typical geographic map. The main layer overlays the visualization on top of the background map.
The visualization layer uses a GridLayer with a custom callback function, createTile which generates Canvas elements on the fly:
L.GridLayer.ClickHouse = L.GridLayer.extend({
	createTile: function(coords, done) {
    	let tile = L.DomUtil.create('canvas', 'leaflet-tile');
    	tile.width = 1024;
    	tile.height = 1024;
    	render(this.options.table, this.options.priority, coords, tile).then(err => done(err, tile));
    	return tile;
	}
});

const layer_options = {
	tileSize: 1024,
	minZoom: 2,
	maxZoom: 19,
	minNativeZoom: 2,
	maxNativeZoom: 16,
	attribution: '(c) Alexey Milovidov, ClickHouse, Inc. (data: adsb.lol, adsbexchange.com)'
};
Each tile has a high resolution of 1024x1024 size to lower the number of requests to the database.
The rendering function performs a request to ClickHouse using its HTTP API with the JavaScript's fetch function:
const query_id = `${uuid}-${query_sequence_num}-${table}-${coords.z - 2}-${coords.x}-${coords.y}`;
const hosts = getHosts(key);
const url = host => `${host}/?user=website&default_format=RowBinary` +
`&query_id=${query_id}&replace_running_query=1` +
`¶m_table=${table}¶m_sampling=${[0, 100, 10, 1][priority]}` +
`¶m_z=${coords.z - 2}¶m_x=${coords.x}¶m_y=${coords.y}`;
progress_update_period = 1;
const response = await Promise.race(hosts.map(host => fetch(url(host), { method: 'POST', body: sql })));
A user can edit the SQL query on the fly using a form on the page to adjust the visualization. This parameterized query accepts tile coordinates (x, y) and zoom level as parameters.
The query returns RGBA values of each pixel of the image in the RowBinary format (1024x1024 pixels, 1048576 rows, 4 bytes each, 4 MiB in total for each tile). It uses ZSTD compression in HTTP response as long as the browser supports it. It was a nice observation that ZSTD compression over raw pixels bitmap works better than PNG! (not surprising, though).
While the image data is often compressed several times, hundreds of megabytes still have to be transferred over the network. This is why the service can feel slow on bad Internet connections.
let ctx = tile.getContext('2d');
let image = ctx.createImageData(1024, 1024, {colorSpace: 'display-p3'});
let arr = new Uint8ClampedArray(buf);

for (let i = 0; i < 1024 * 1024 * 4; ++i) { image.data[i] = arr[i]; }

ctx.putImageData(image, 0, 0, 0, 0, 1024, 1024);
The data is put on the canvas using the "Display P3" color space to have a wider gamut in supporting browsers.
We use three different tables with different levels of detail: planes_mercator contains 100% of the data, planes_mercator_sample10 10%, and planes_mercator_sample100 1%. The loading starts with a 1% sample to provide instant response even while rendering the whole world. After loading the first level of detail, it continues to the next level of 10% before progressing with 100% of the data. This delivers a nice effect on progressive loading.
The image data is also cached on the client using a simple JavaScript object:
if (!cached_tiles[key]) cached_tiles[key] = [];
/// If there is a higer-detail tile, skip rendering of this level of detal.
if (cached_tiles[key][priority + 1]) return;
buf = cached_tiles[key][priority];
The only downside is that after browsing for a certain time, the page will eat too much memory - something to address in future versions.
Database and Queries
The database is small by ClickHouse standards. As of March 29th, 2024, it had 44.47 billion rows in the planes_mercator table and was continuously updated with new records. It takes 1.6 TB of disk space.
The table schema is as follows (you can read it in the setup.sql source):
CREATE TABLE planes_mercator
(
    `mercator_x` UInt32 MATERIALIZED 4294967295 * ((lon + 180) / 360),
    `mercator_y` UInt32 MATERIALIZED 4294967295 * ((1 / 2) - ((log(tan(((lat + 90) / 360) * pi())) / 2) / pi())),
    `time` DateTime64(3),
    `date` Date,
    `icao` String,
    `r` String,
    `t` LowCardinality(String),
    `dbFlags` Int32,
    `noRegData` Bool,
    `ownOp` LowCardinality(String),
    `year` UInt16,
    `desc` LowCardinality(String),
    `lat` Float64,
    `lon` Float64,
    `altitude` Int32,
    `ground_speed` Float32,
    `track_degrees` Float32,
    `flags` UInt32,
    `vertical_rate` Int32,
    `aircraft_alert` Int64,
    `aircraft_alt_geom` Int64,
    `aircraft_gva` Int64,
    `aircraft_nac_p` Int64,
    `aircraft_nac_v` Int64,
    `aircraft_nic` Int64,
    `aircraft_nic_baro` Int64,
    `aircraft_rc` Int64,
    `aircraft_sda` Int64,
    `aircraft_sil` Int64,
    `aircraft_sil_type` LowCardinality(String),
    `aircraft_spi` Int64,
    `aircraft_track` Float64,
    `aircraft_type` LowCardinality(String),
    `aircraft_version` Int64,
    `aircraft_category` Enum8('A0', 'A1', 'A2', 'A3', 'A4', 'A5', 'A6', 'A7', 'B0', 'B1', 'B2', 'B3', 'B4', 'B5', 'B6', 'B7', 'C0', 'C1', 'C2', 'C3', 'C4', 'C5', 'C6', 'C7', 'D0', 'D1', 'D2', 'D3', 'D4', 'D5', 'D6', 'D7', ''),
    `aircraft_emergency` Enum8('', 'none', 'general', 'downed', 'lifeguard', 'minfuel', 'nordo', 'unlawful', 'reserved'),
    `aircraft_flight` LowCardinality(String),
    `aircraft_squawk` String,
    `aircraft_baro_rate` Int64,
    `aircraft_nav_altitude_fms` Int64,
    `aircraft_nav_altitude_mcp` Int64,
    `aircraft_nav_modes` Array(Enum8('althold', 'approach', 'autopilot', 'lnav', 'tcas', 'vnav')),
    `aircraft_nav_qnh` Float64,
    `aircraft_geom_rate` Int64,
    `aircraft_ias` Int64,
    `aircraft_mach` Float64,
    `aircraft_mag_heading` Float64,
    `aircraft_oat` Int64,
    `aircraft_roll` Float64,
    `aircraft_tas` Int64,
    `aircraft_tat` Int64,
    `aircraft_true_heading` Float64,
    `aircraft_wd` Int64,
    `aircraft_ws` Int64,
    `aircraft_track_rate` Float64,
    `aircraft_nav_heading` Float64,
    `source` LowCardinality(String),
    `geometric_altitude` Int32,
    `geometric_vertical_rate` Int32,
    `indicated_airspeed` Int32,
    `roll_angle` Float32,
    INDEX idx_x mercator_x TYPE minmax GRANULARITY 1,
    INDEX idx_y mercator_y TYPE minmax GRANULARITY 1
)
ENGINE = MergeTree
ORDER BY (mortonEncode(mercator_x, mercator_y), time)
This schema contains lat and lon values that are converted to coordinates in the Web-Mercator projection automatically with MATERIALIZED columns. This is used by the Leaflet software and most of the maps on the Internet. The Mercator coordinates are stored in UInt32, making it easy to do arithmetics with tile coordinates and zoom levels in a SQL query.
A Morton Curve of Web Mercator sorts the table coordinates with a minmax index, allowing queries for certain tiles to only read the data they need.
Materialized Views are used to produce the tables for different detail levels:
CREATE TABLE planes_mercator_sample10 AS planes_mercator;

CREATE TABLE planes_mercator_sample100 AS planes_mercator;

CREATE MATERIALIZED VIEW view_sample10 TO planes_mercator_sample10
AS SELECT *
FROM planes_mercator
WHERE (rand() % 10) = 0;

CREATE MATERIALIZED VIEW view_sample100 TO planes_mercator_sample100
AS SELECT *
FROM planes_mercator
WHERE (rand() % 100) = 0;
Using ClickHouse Cloud
We use a service on our staging environment in ClickHouse Cloud. The staging environment is used to test new ClickHouse versions and new types of infrastructure that we implement.
For example, we can try different types of machines and different scales of the service, or we can test new features, such as distributed cache, that are in development.
The staging environment also uses fault injection: We interrupt network connections with a certain probability to ensure that the service operates normally. Furthermore, it exploits chaos engineering: We terminate various machines of clickhouse-server and clickhouse-keeper at random and also randomly scale the service back and forth to a different number of machines. This is how this project facilitates the development and testing of our service.
Finally, requests are also load-balanced to a backup service. Whichever service returns first will be used. This is how we can avoid downtime while still using our staging environment.
Example query: Boeing vs. Airbus
Consider the following rather topical visualization: "Boeing vs. Airbus".
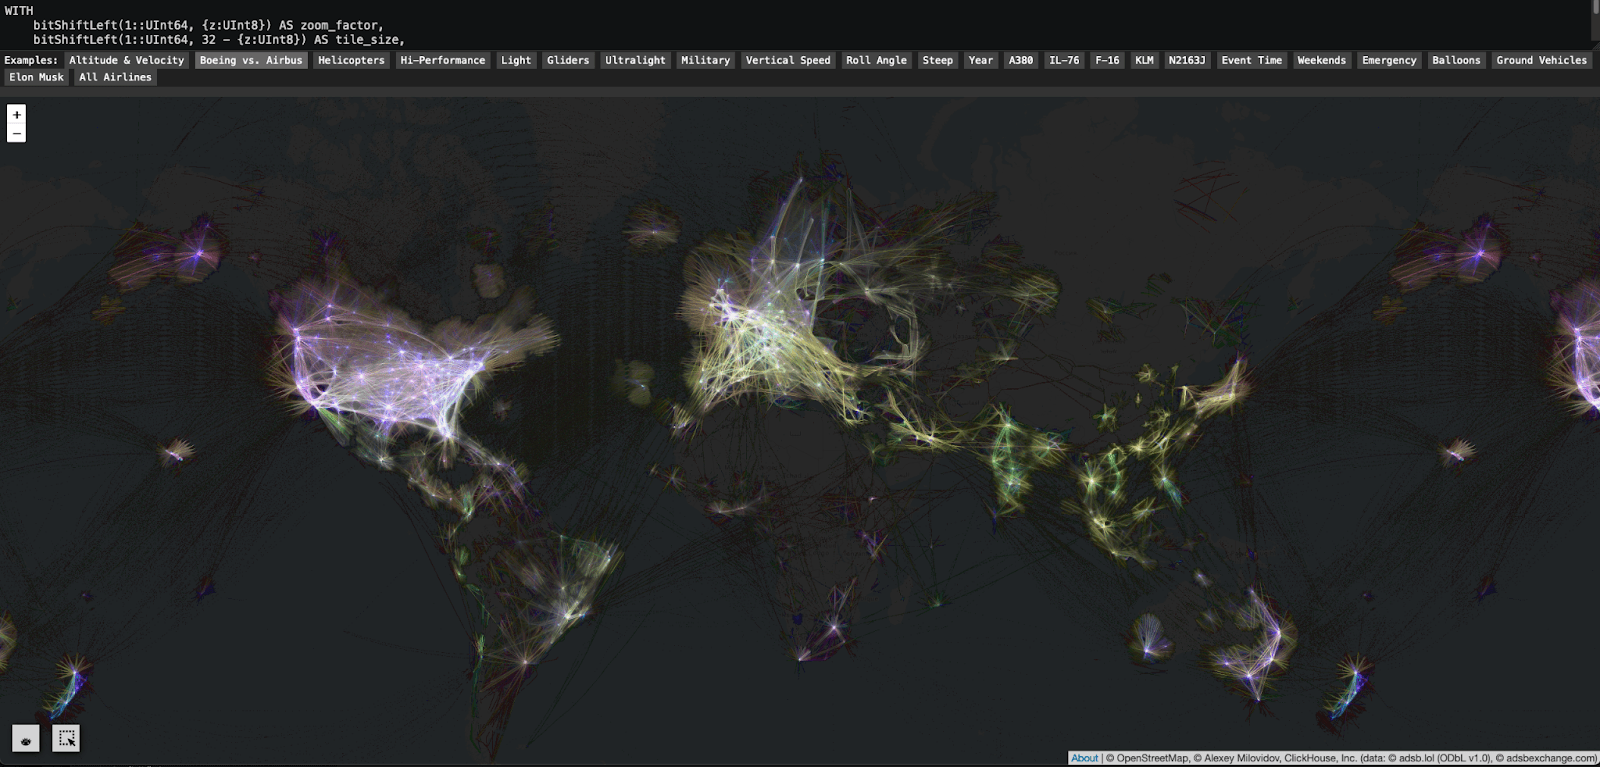
Let's take a look at an SQL query for this visualization:
WITH
	bitShiftLeft(1::UInt64, {z:UInt8}) AS zoom_factor,
	bitShiftLeft(1::UInt64, 32 - {z:UInt8}) AS tile_size,

	tile_size * {x:UInt16} AS tile_x_begin,
	tile_size * ({x:UInt16} + 1) AS tile_x_end,

	tile_size * {y:UInt16} AS tile_y_begin,
	tile_size * ({y:UInt16} + 1) AS tile_y_end,

	mercator_x >= tile_x_begin AND mercator_x < tile_x_end
	AND mercator_y >= tile_y_begin AND mercator_y < tile_y_end AS in_tile,

	bitShiftRight(mercator_x - tile_x_begin, 32 - 10 - {z:UInt8}) AS x,
	bitShiftRight(mercator_y - tile_y_begin, 32 - 10 - {z:UInt8}) AS y,

	y * 1024 + x AS pos,

	count() AS total,
	sum(desc LIKE 'BOEING%') AS boeing,
	sum(desc LIKE 'AIRBUS%') AS airbus,
	sum(NOT (desc LIKE 'BOEING%' OR desc LIKE 'AIRBUS%')) AS other,

	greatest(1000000 DIV {sampling:UInt32} DIV zoom_factor, total) AS max_total,
	greatest(1000000 DIV {sampling:UInt32} DIV zoom_factor, boeing) AS max_boeing,
	greatest(1000000 DIV {sampling:UInt32} DIV zoom_factor, airbus) AS max_airbus,
	greatest(1000000 DIV {sampling:UInt32} DIV zoom_factor, other) AS max_other,

	pow(total / max_total, 1/5) AS transparency,

	255 * (1 + transparency) / 2 AS alpha,
	pow(boeing, 1/5) * 256 DIV (1 + pow(max_boeing, 1/5)) AS red,
	pow(airbus, 1/5) * 256 DIV (1 + pow(max_airbus, 1/5)) AS green,
	pow(other, 1/5) * 256 DIV (1 + pow(max_other, 1/5)) AS blue

SELECT round(red)::UInt8, round(green)::UInt8, round(blue)::UInt8, round(alpha)::UInt8
FROM {table:Identifier}
WHERE in_tile
GROUP BY pos ORDER BY pos WITH FILL FROM 0 TO 1024*1024
The first part of the query calculates the condition in_tile, which is used in the WHERE section to filter the data in the requested tile. It then calculates the colors: alpha, red, green, and blue. They are adjusted by the pow function for better uniformity, clamped to the 0..255 range, and converted to UInt8. The sampling parameter is used for adjustment so that queries with a lower level of detail will return pictures with mostly the same relative colors. We group by the pixel coordinate pos and also use the WITH FILL modifier in the ORDER BY to fill zeros in the pixel positions that have no data. As a result, we will get an RGBA bitmap with the exact 1024x1024 size.
Reports
If you select an area with the right mouse button or use a selection tool, it will generate a report from the database for the selection area. This is entirely straightforward. For example, here is a query for the top aircraft types:
const sql_types = `
	WITH mercator_x >= {left:UInt32} AND mercator_x < {right:UInt32}
    	AND mercator_y >= {top:UInt32} AND mercator_y < {bottom:UInt32} AS in_tile
	SELECT t, anyIf(desc, desc != '') AS desc, count() AS c
	FROM {table:Identifier}
	WHERE t != '' AND ${condition}
	GROUP BY t
	ORDER BY c DESC
	LIMIT 100`;
The report is calculated for flight numbers, aircraft types, registration (tail numbers), and owners. You can click on any item and it will apply a filter to the main SQL query. For example, click on A388 and it will show you a visualization for the Airbus 380-800.
As a bonus, if you move the cursor over an aircraft type, it will go to Wikipedia API and try to find a picture of this aircraft. It often finds something else on Wikipedia, though.
Saved Queries
You can edit a query and then share a link. The query is converted to a 128-bit hash and saved in the same ClickHouse database:
async function saveQuery(text) {
const sql = `INSERT INTO saved_queries (text) FORMAT RawBLOB`;
const hosts = getHosts(null);
const url = host => `${host}/?user=website_saved_queries&query=${encodeURIComponent(sql)}`;
const response = await Promise.all(hosts.map(host => fetch(url(host), { method: 'POST', body: text })));
}
async function loadQuery(hash) {
const sql = `SELECT text FROM saved_queries WHERE hash = unhex({hash:String}) LIMIT 1`;
const hosts = getHosts(null);
const url = host => `${host}/?user=website_saved_queries&default_format=JSON¶m_hash=${hash}`;
const response = await Promise.race(hosts.map(host => fetch(url(host), { method: 'POST', body: sql })));
const data = await response.json();
return data.data[0].text;
}
We use a different user website_saved_queries with different access control and quotas for these queries.
Progress Bar
It is nice to display a progress bar with the amount of data processed in rows and bytes.
const sql = `SELECT
sum(read_rows) AS r,
sum(total_rows_approx) AS t,
sum(read_bytes) AS b,
r / max(elapsed) AS rps,
b / max(elapsed) AS bps,
formatReadableQuantity(r) AS formatted_rows,
formatReadableSize(b) AS formatted_bytes,
formatReadableQuantity(rps) AS formatted_rps,
formatReadableSize(bps) AS formatted_bps
FROM clusterAllReplicas(default, system.processes)
WHERE user = 'website' AND startsWith(query_id, {uuid:String})`;
const hosts = getHosts(uuid);
const url = host => `${host}/?user=website_progress&default_format=JSON¶m_uuid=${uuid}`;
let responses = await Promise.all(hosts.map(host => fetch(url(host), { method: 'POST', body: sql })));
let datas = await Promise.all(responses.map(response => response.json()));
We select from the system.processes table across all servers in the cluster. It does not display the precise progress because there are many tiles requested in parallel and many queries, with some of them finished and some still in progress. The query will see only in-progress queries, so the total processed records will be lower than the actual.
We also color the progress bar differently when we are loading the first level of detail, the second level of detail, etc.
Cache Locality
The service in ClickHouse Cloud can use multiple replicas, and by default, the requests are routed to an arbitrary healthy replica. Queries that process a large amount of data will be parallelized across many replicas, whereas simpler queries will use just a single replica. The data is stored in AWS S3 and each replica pod also has a locally attached SSD which is used for the cache, and consequently, the page cache in memory also impacts the final query time.
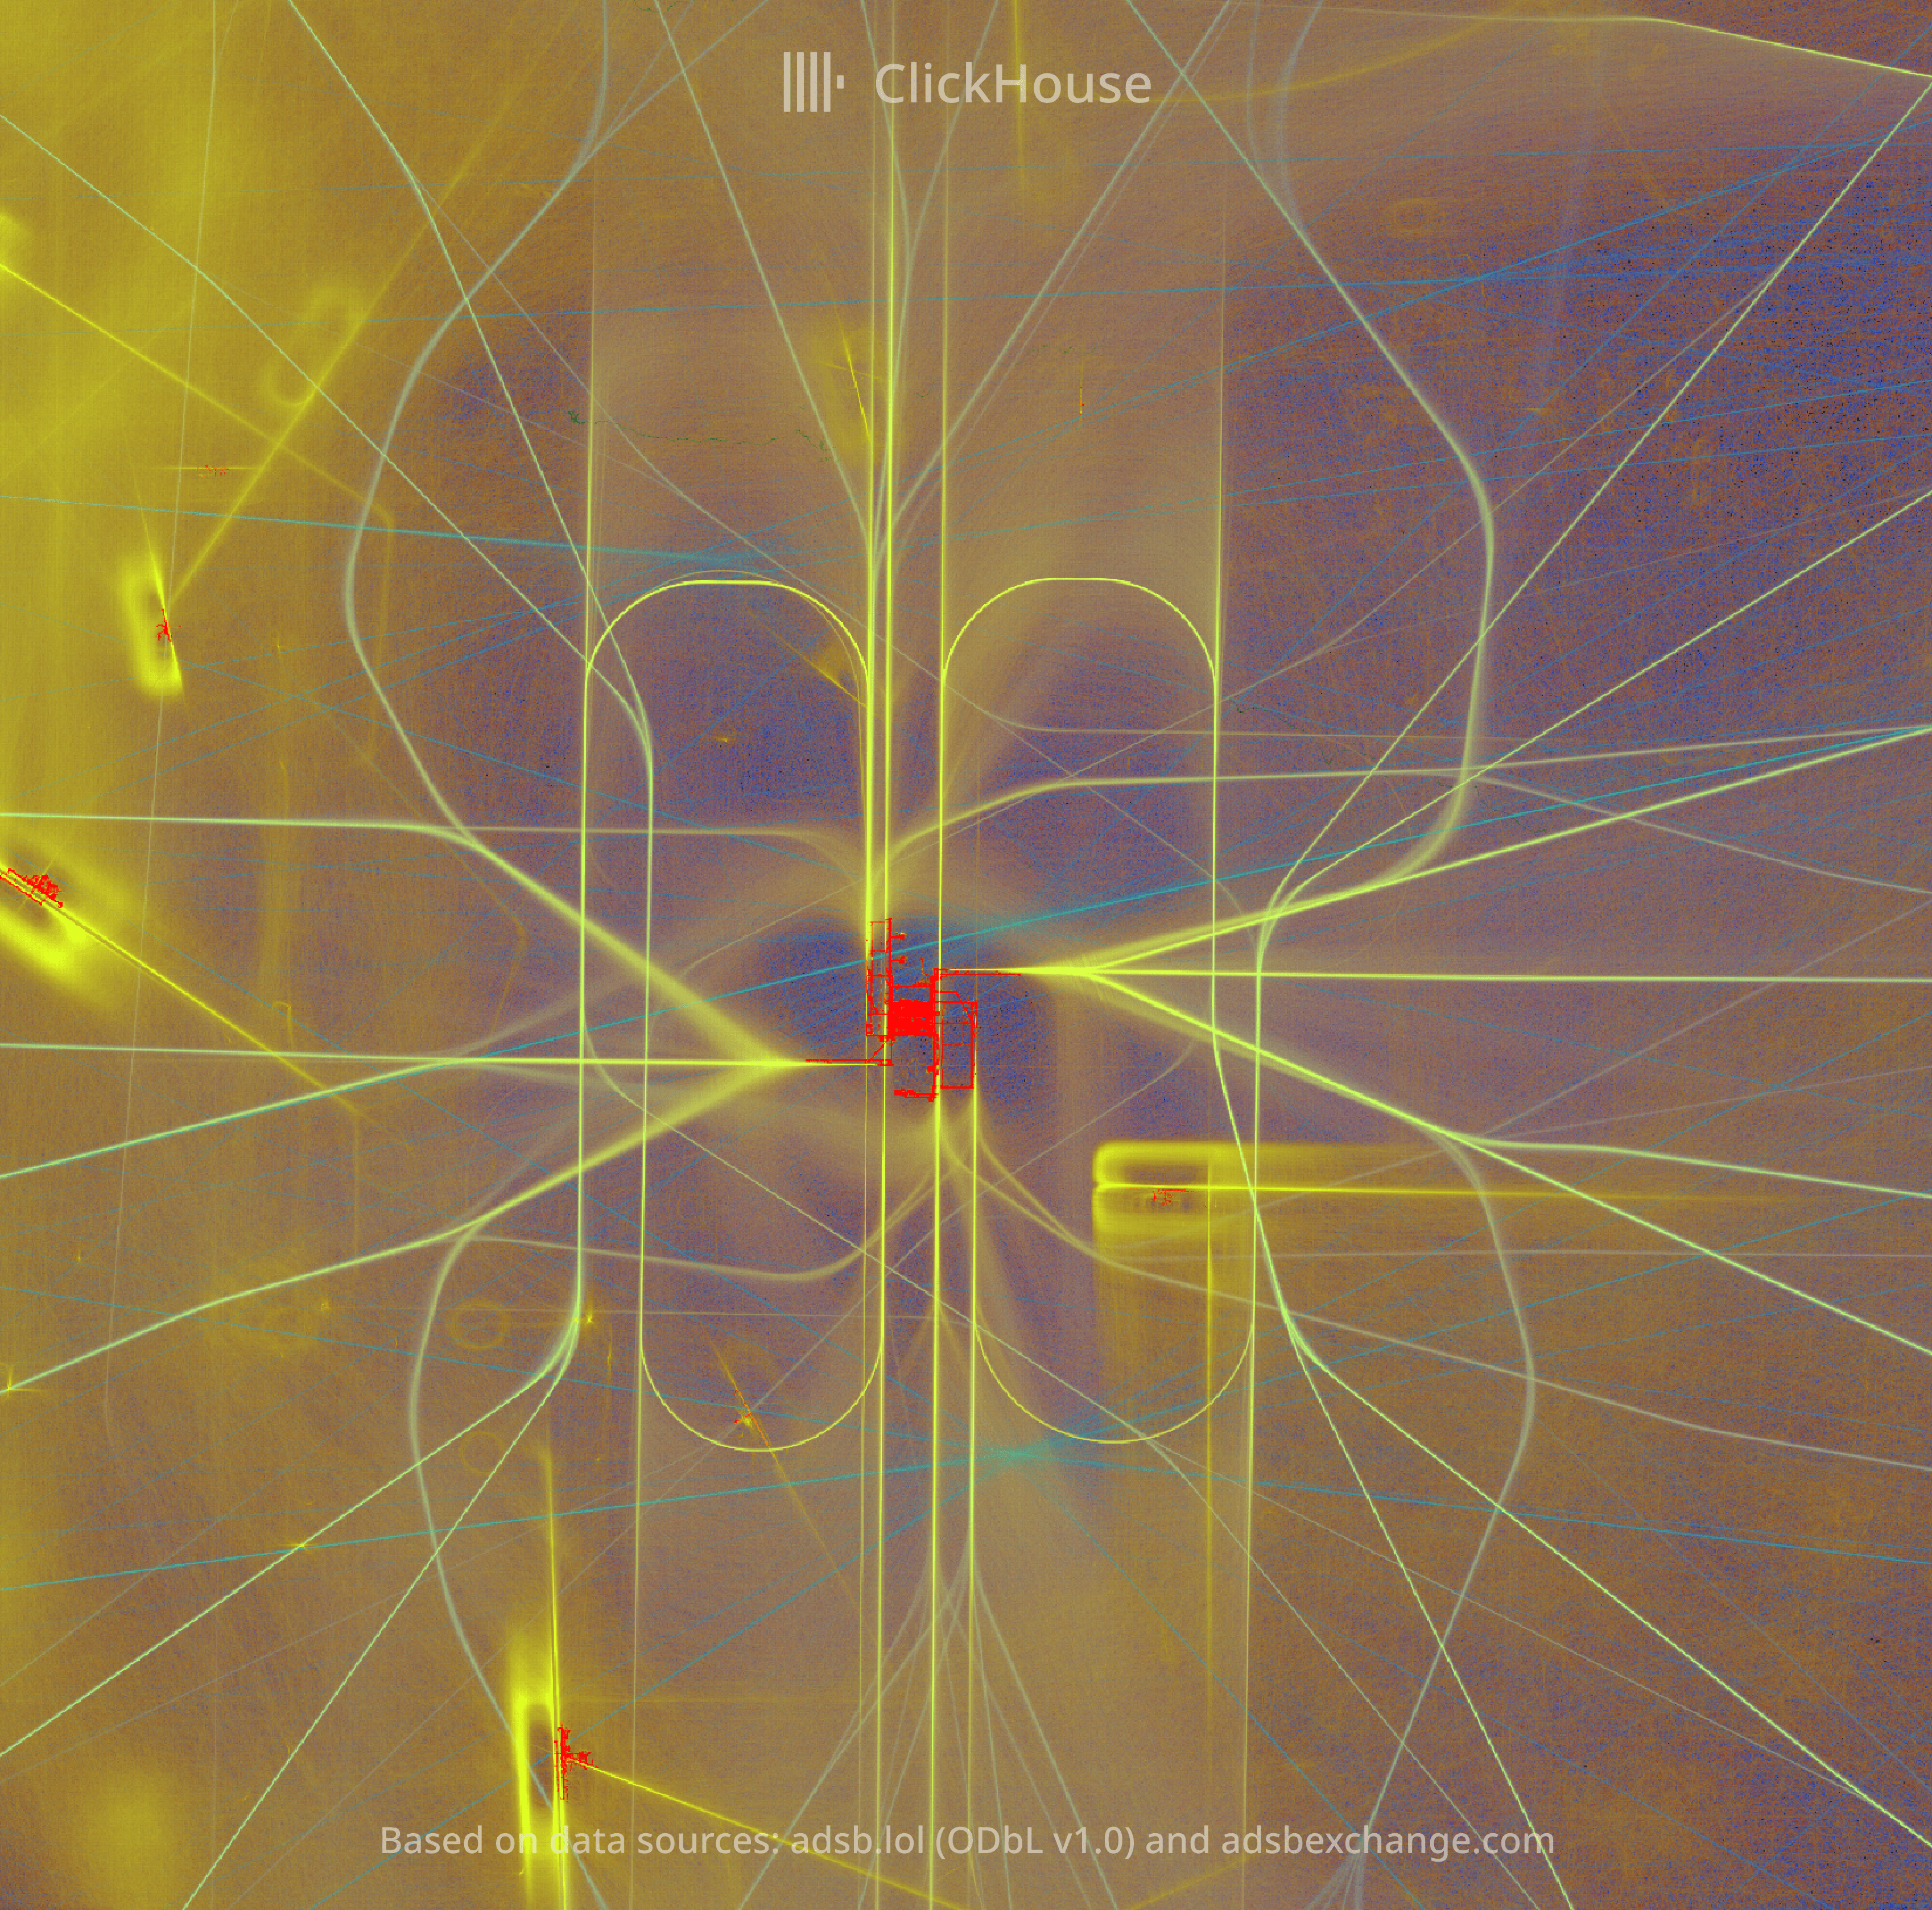
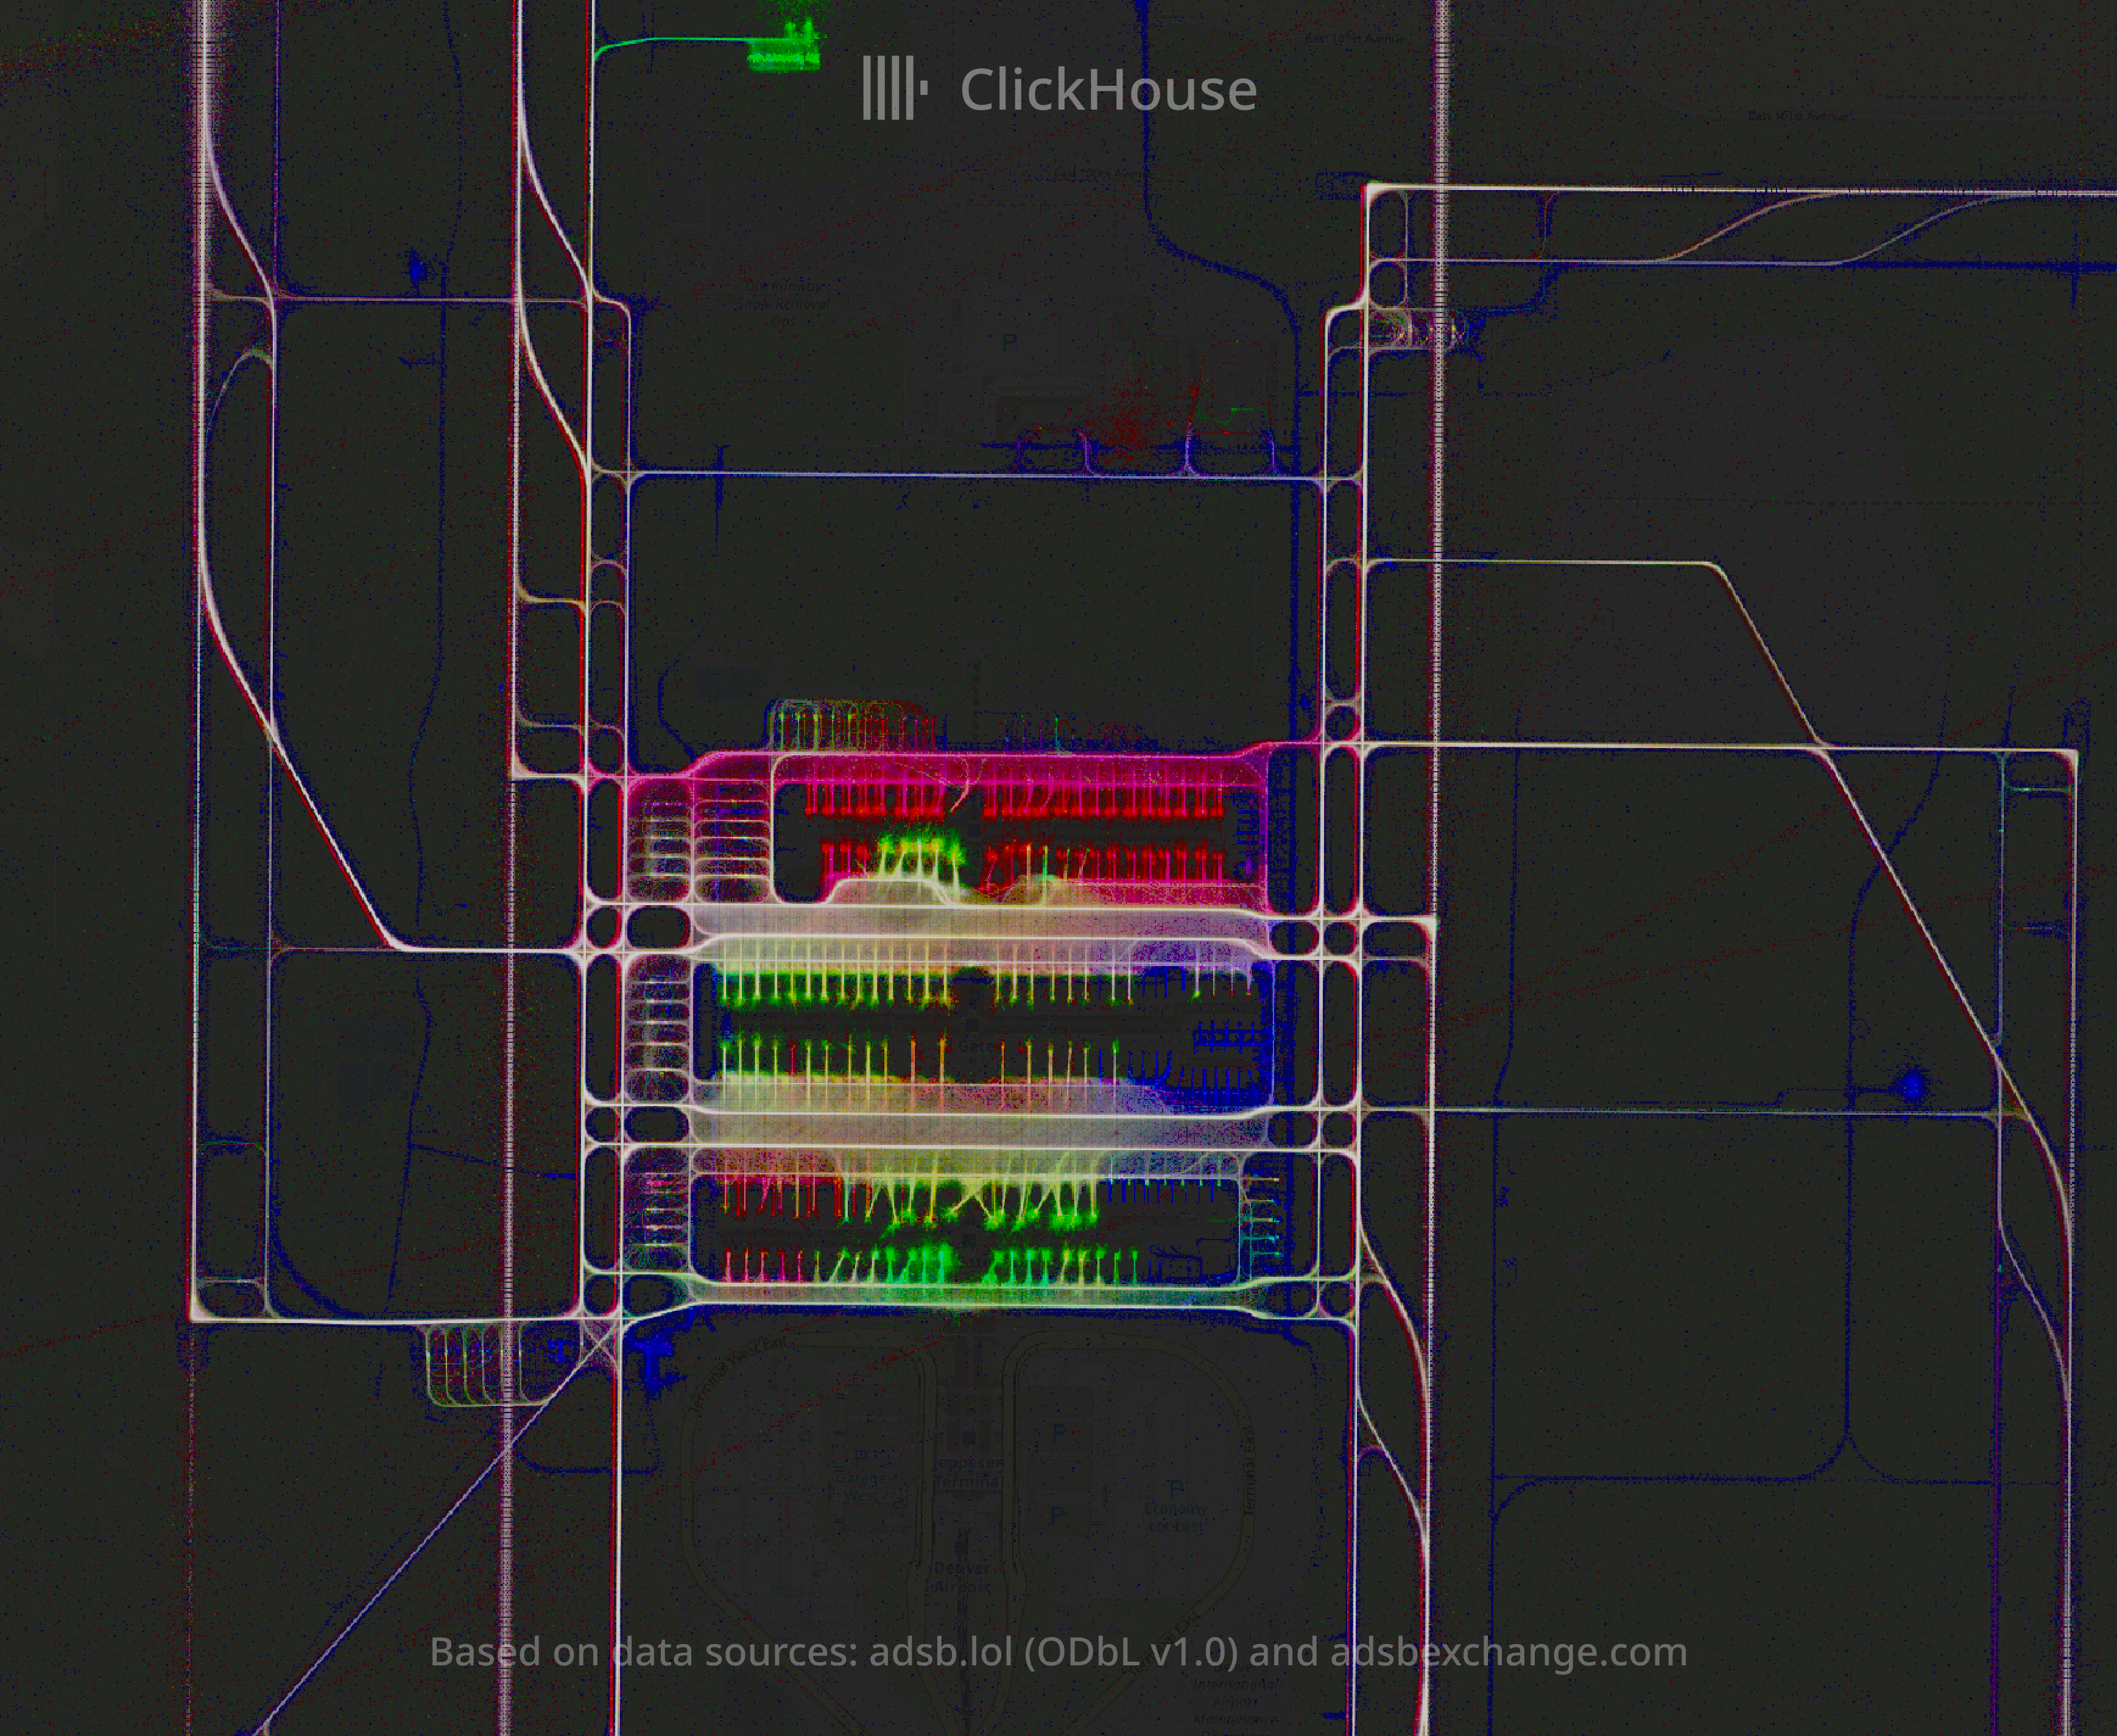
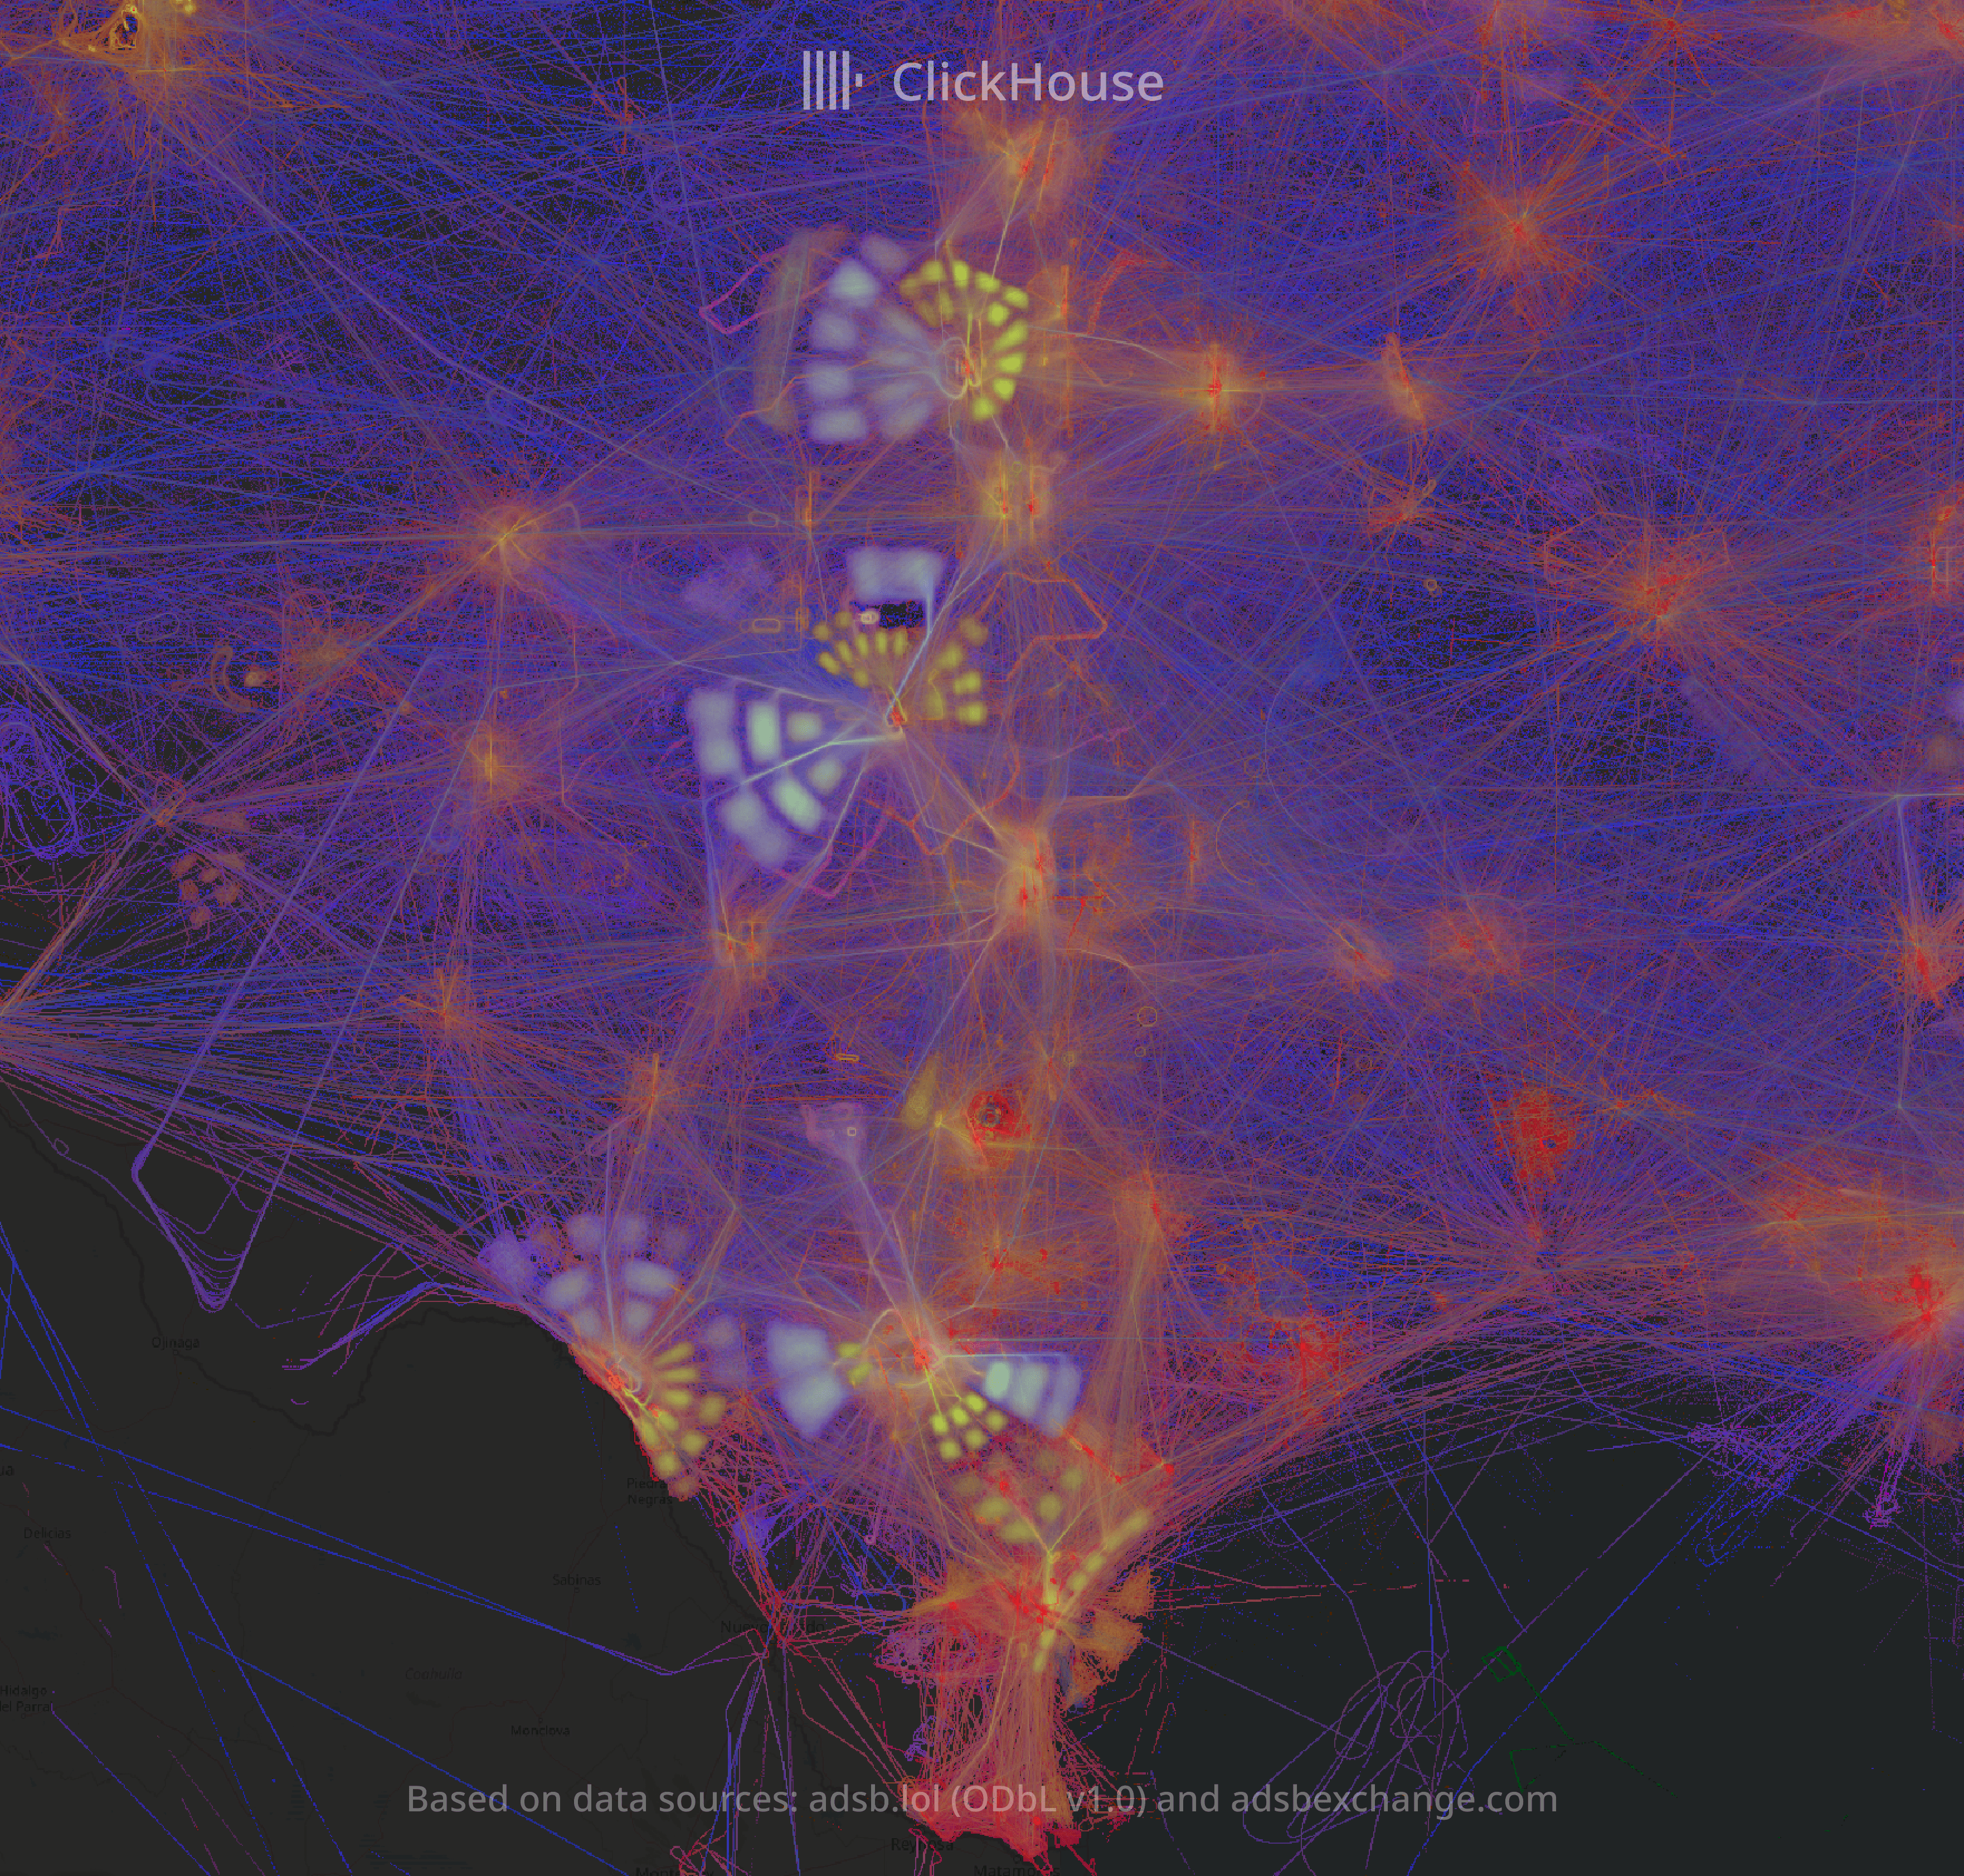
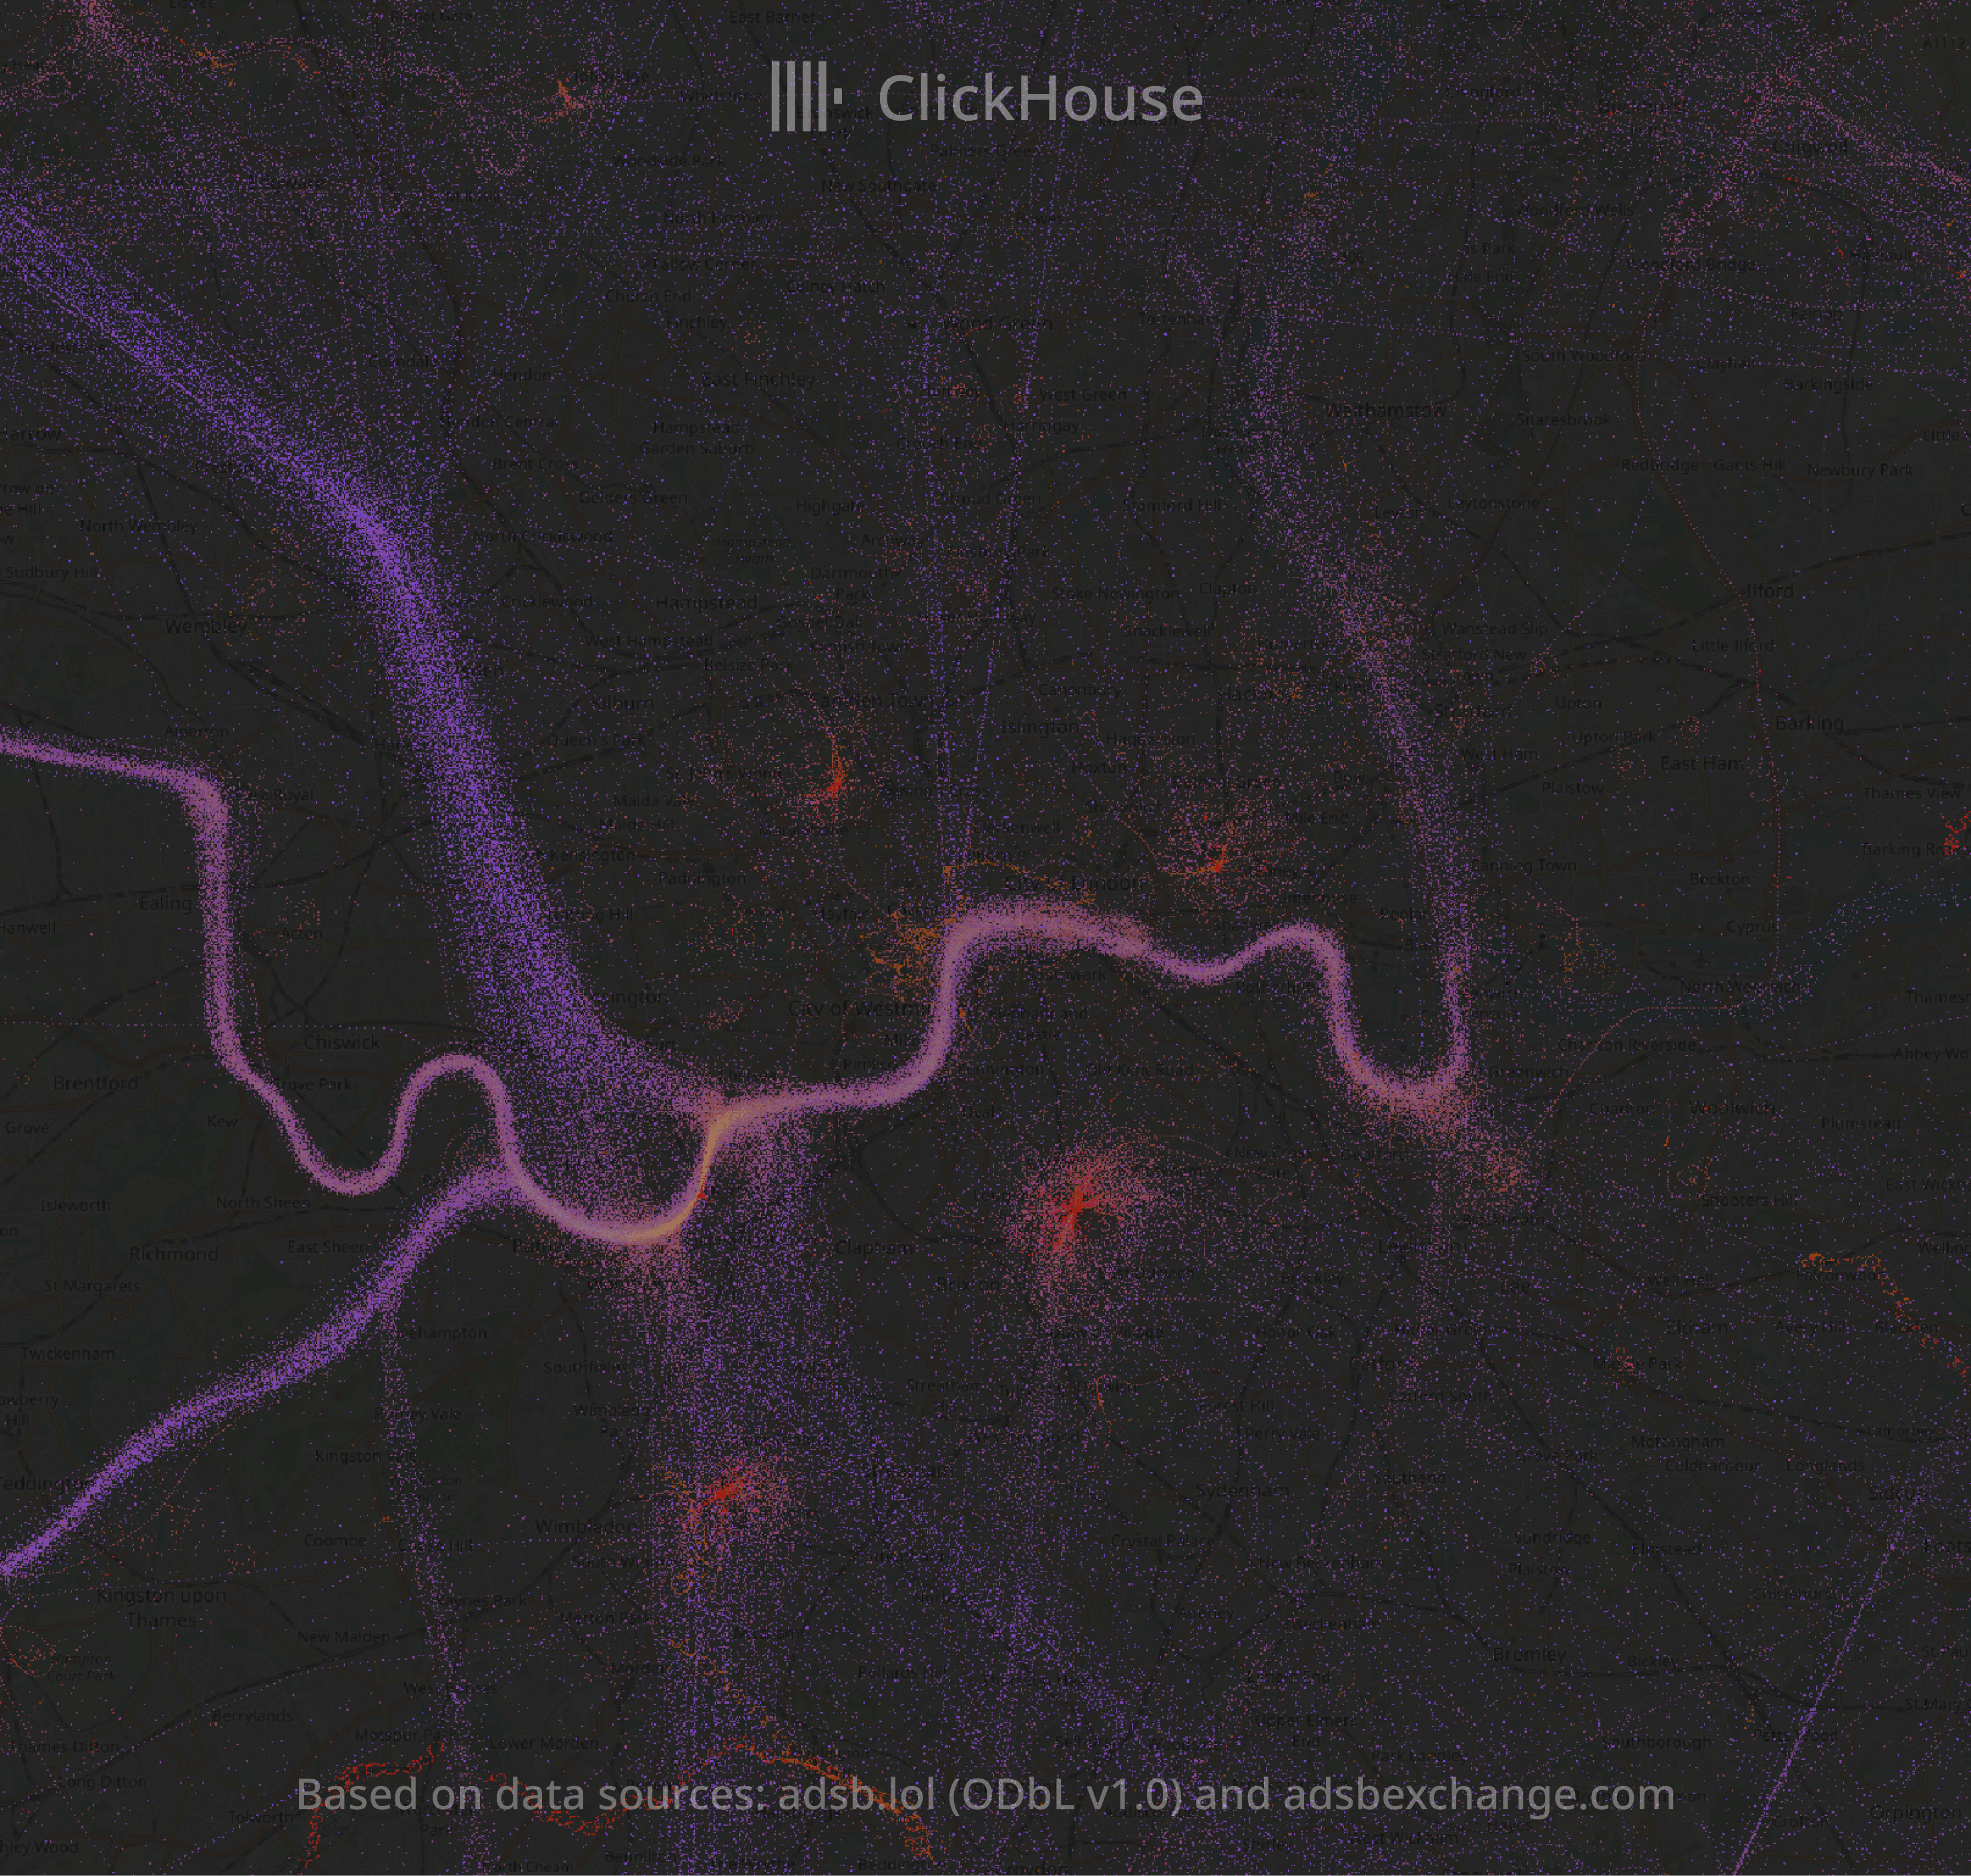
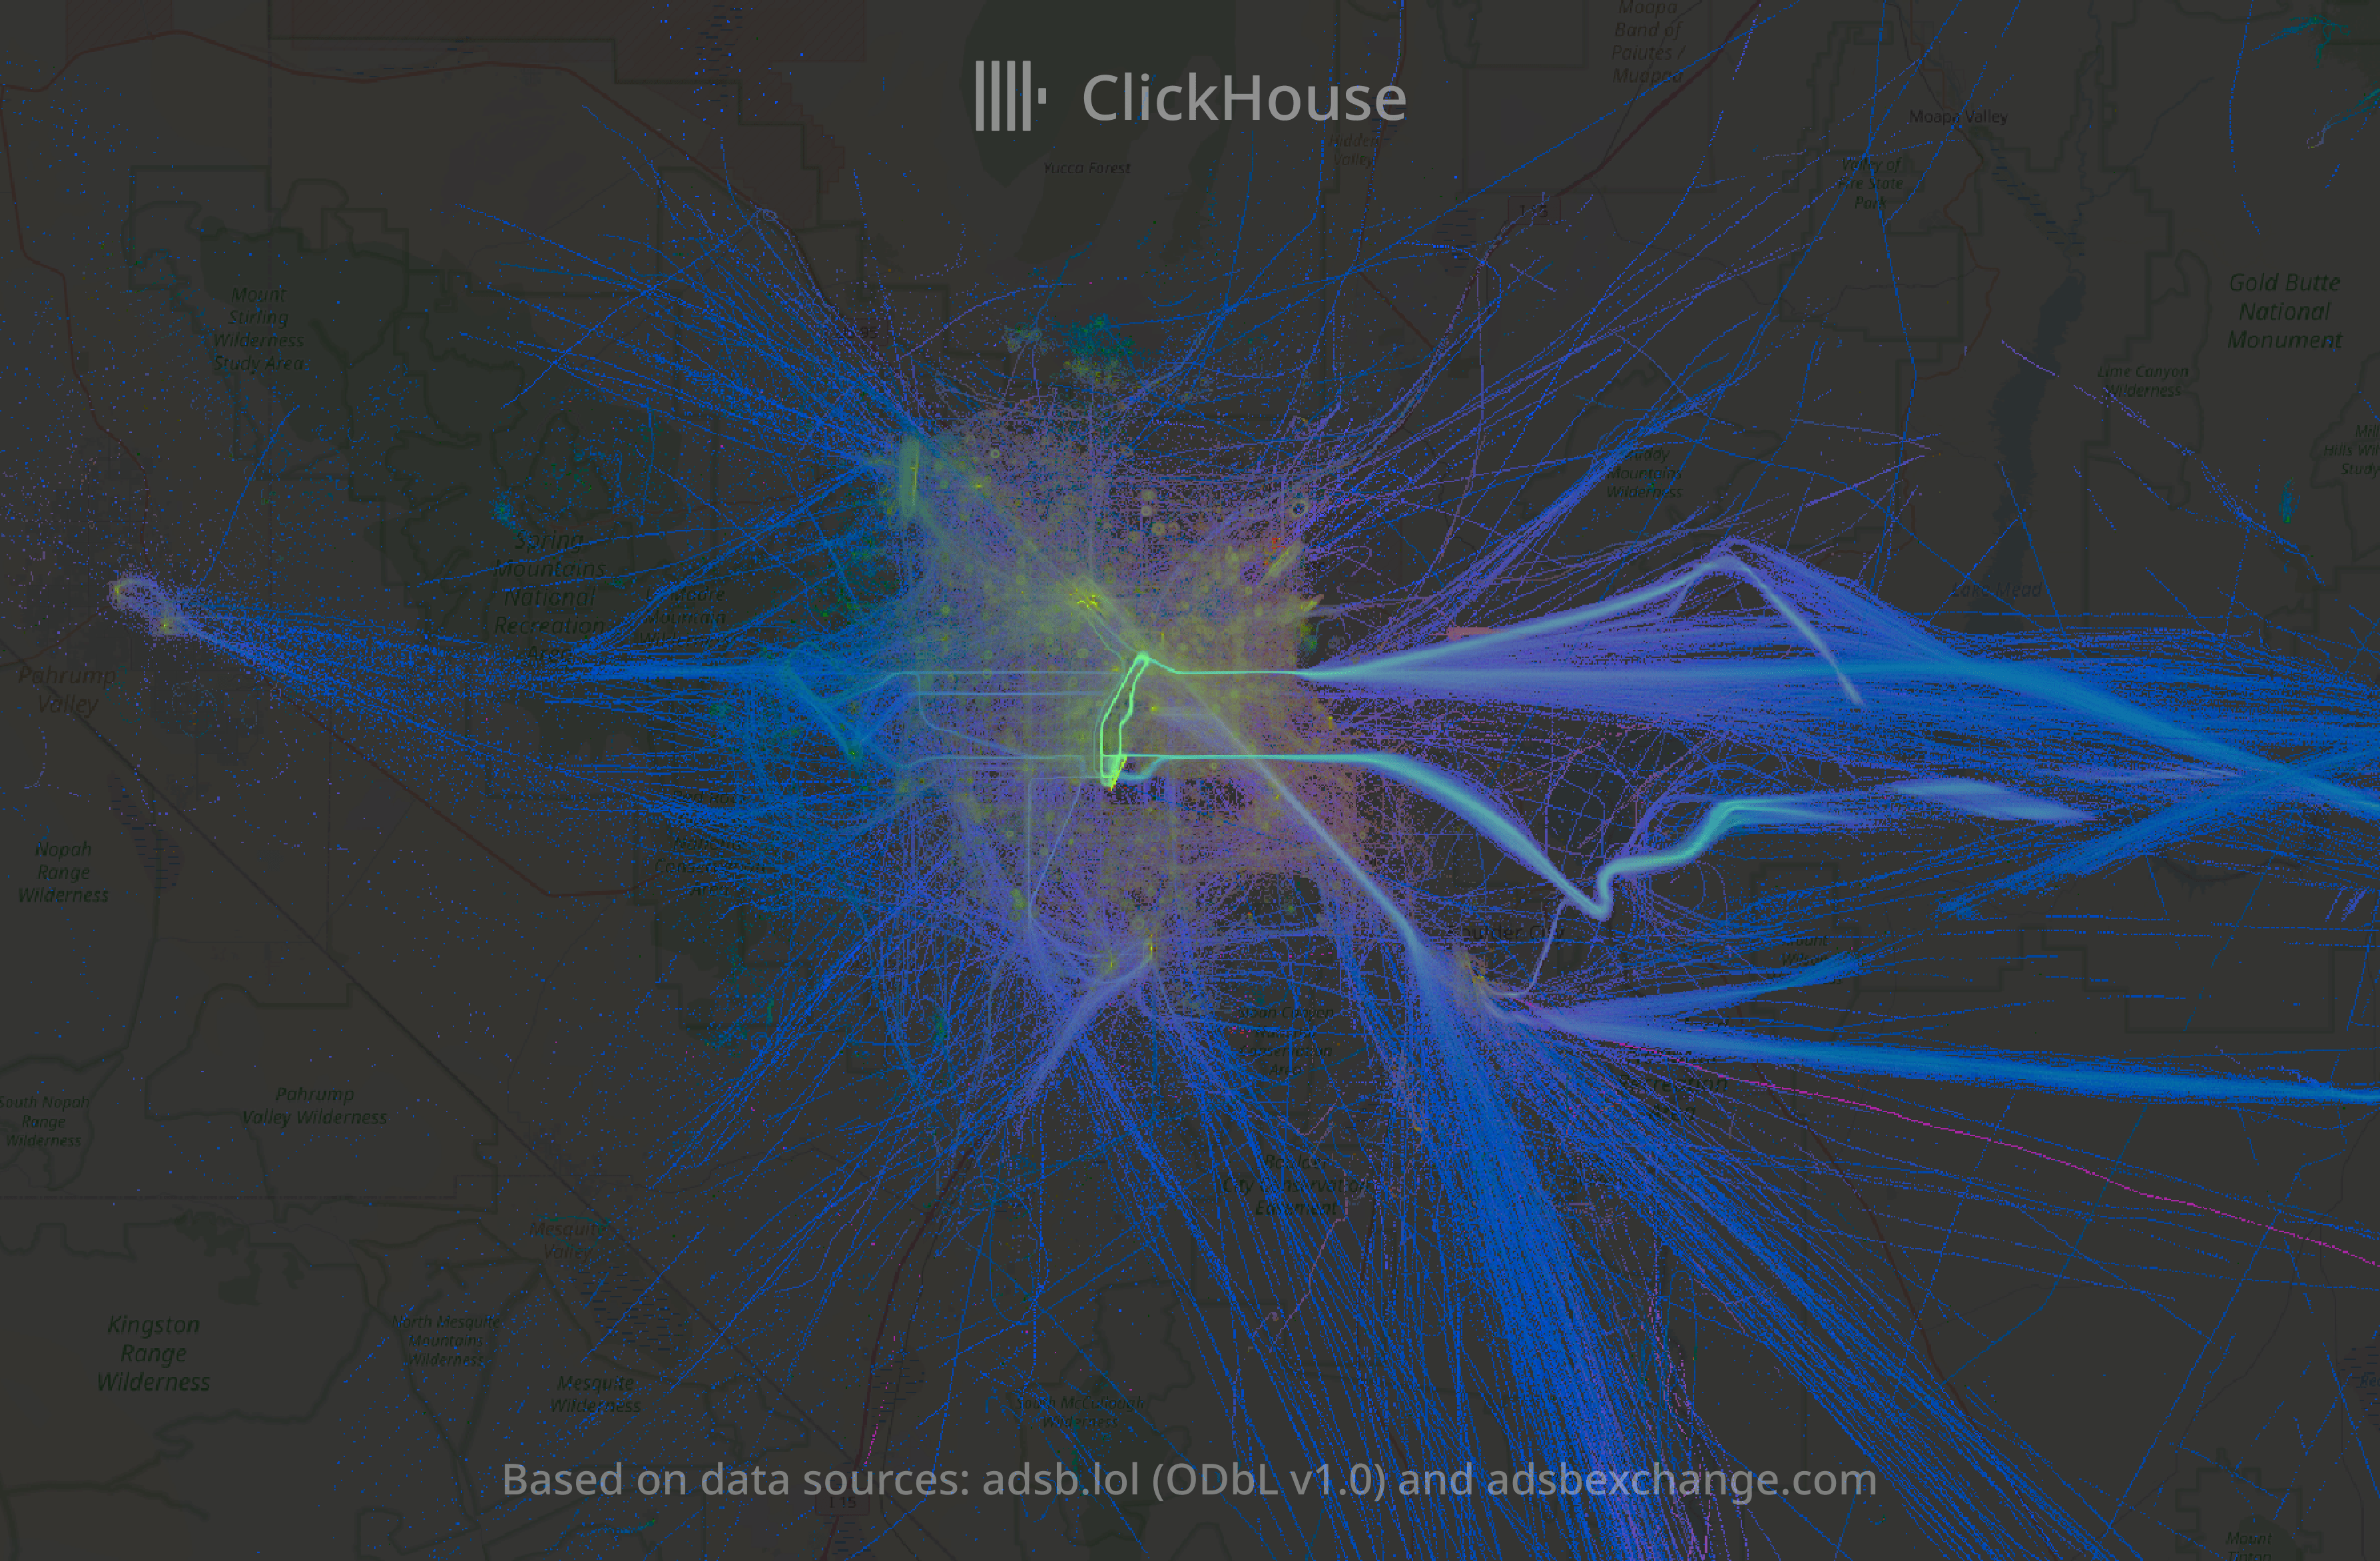
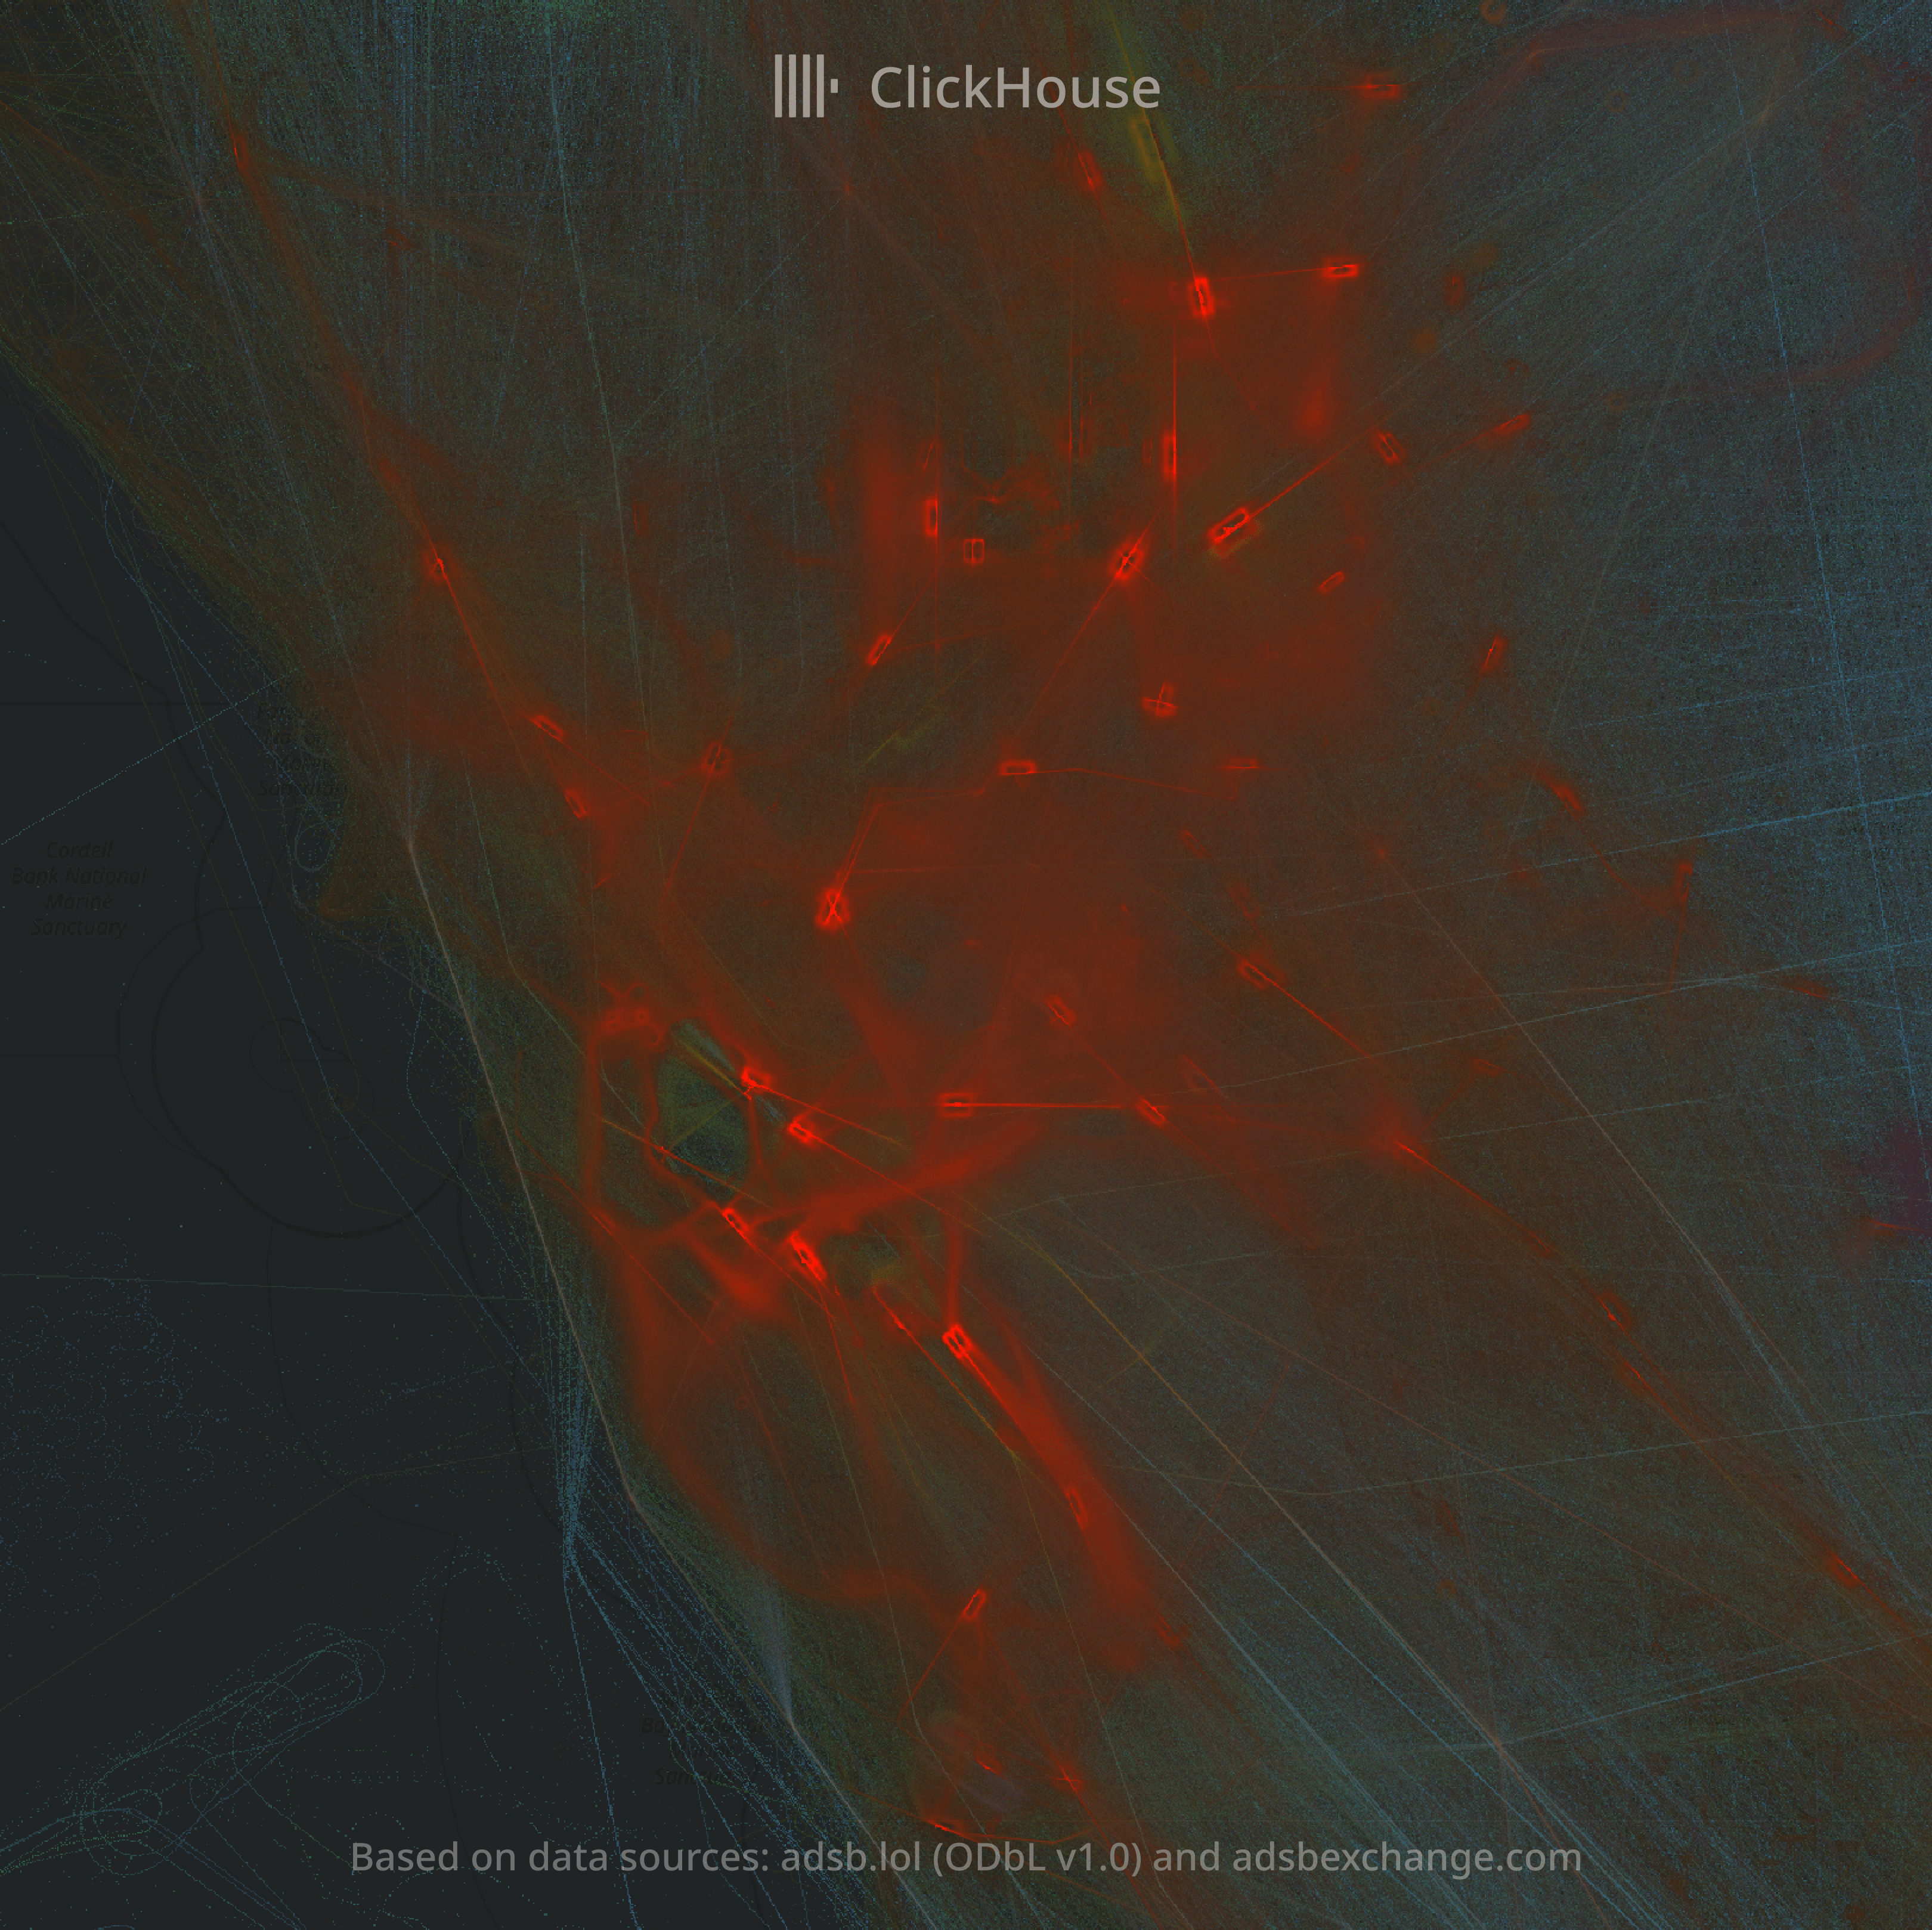
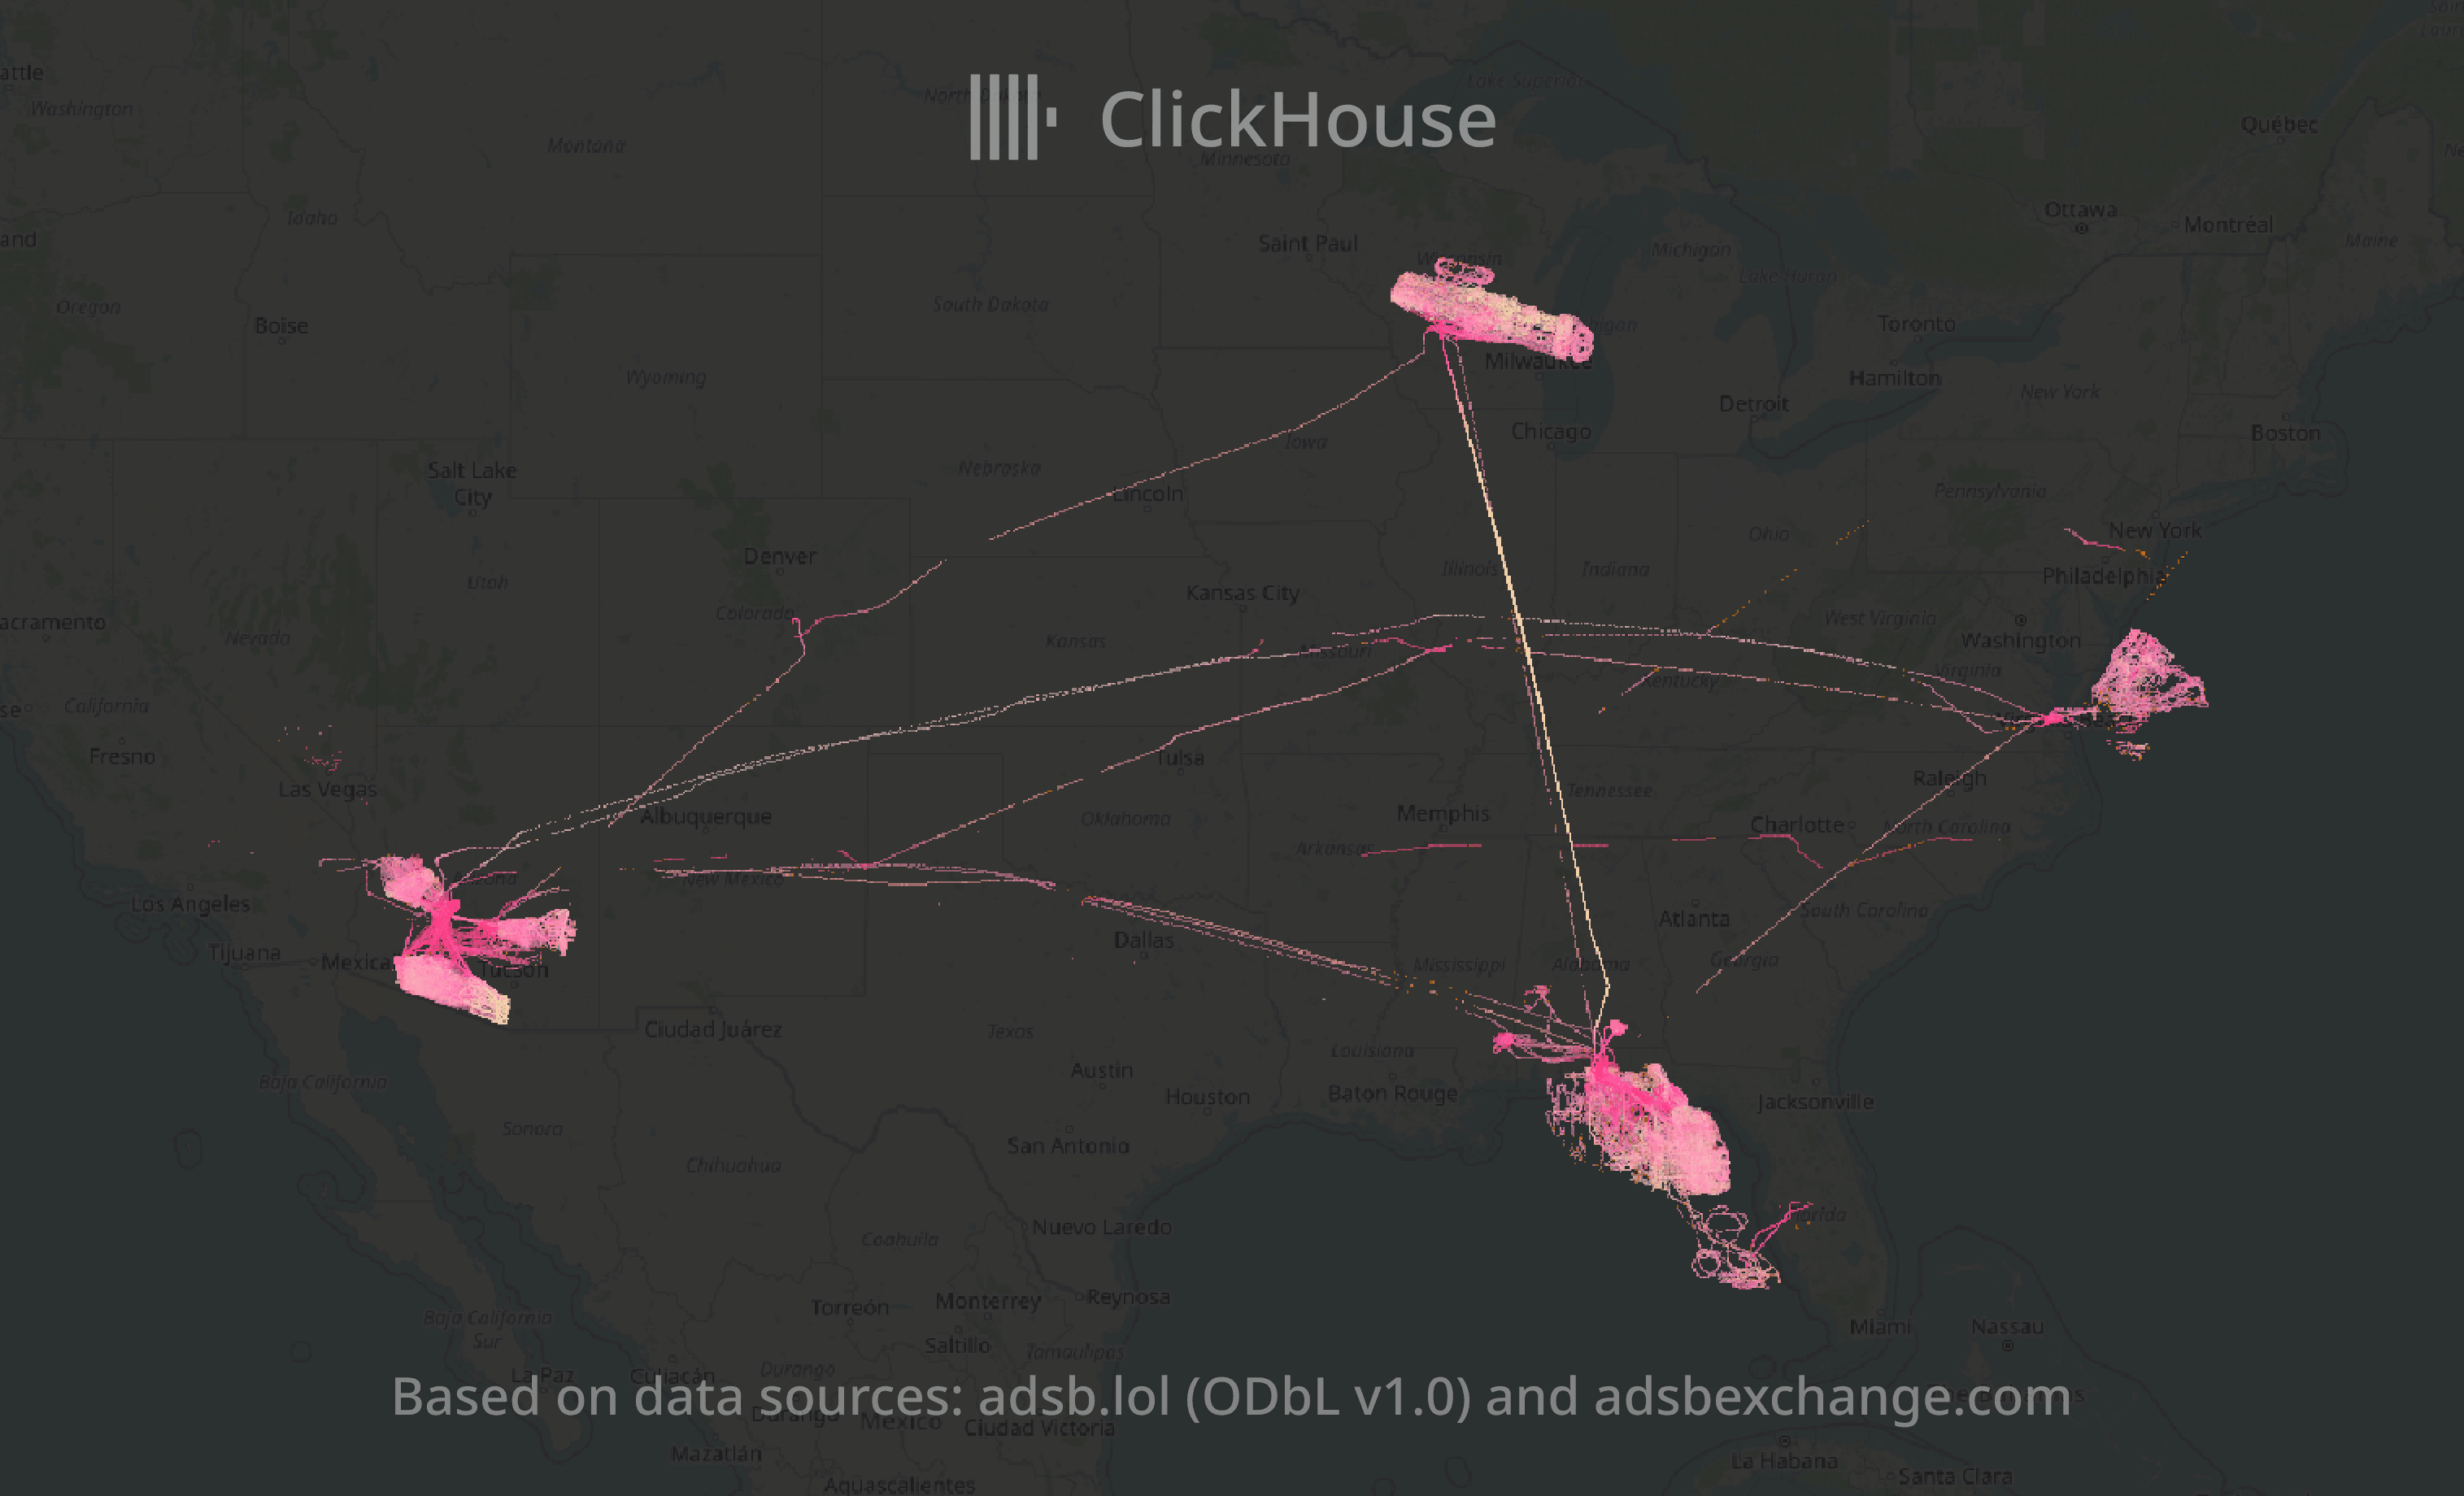
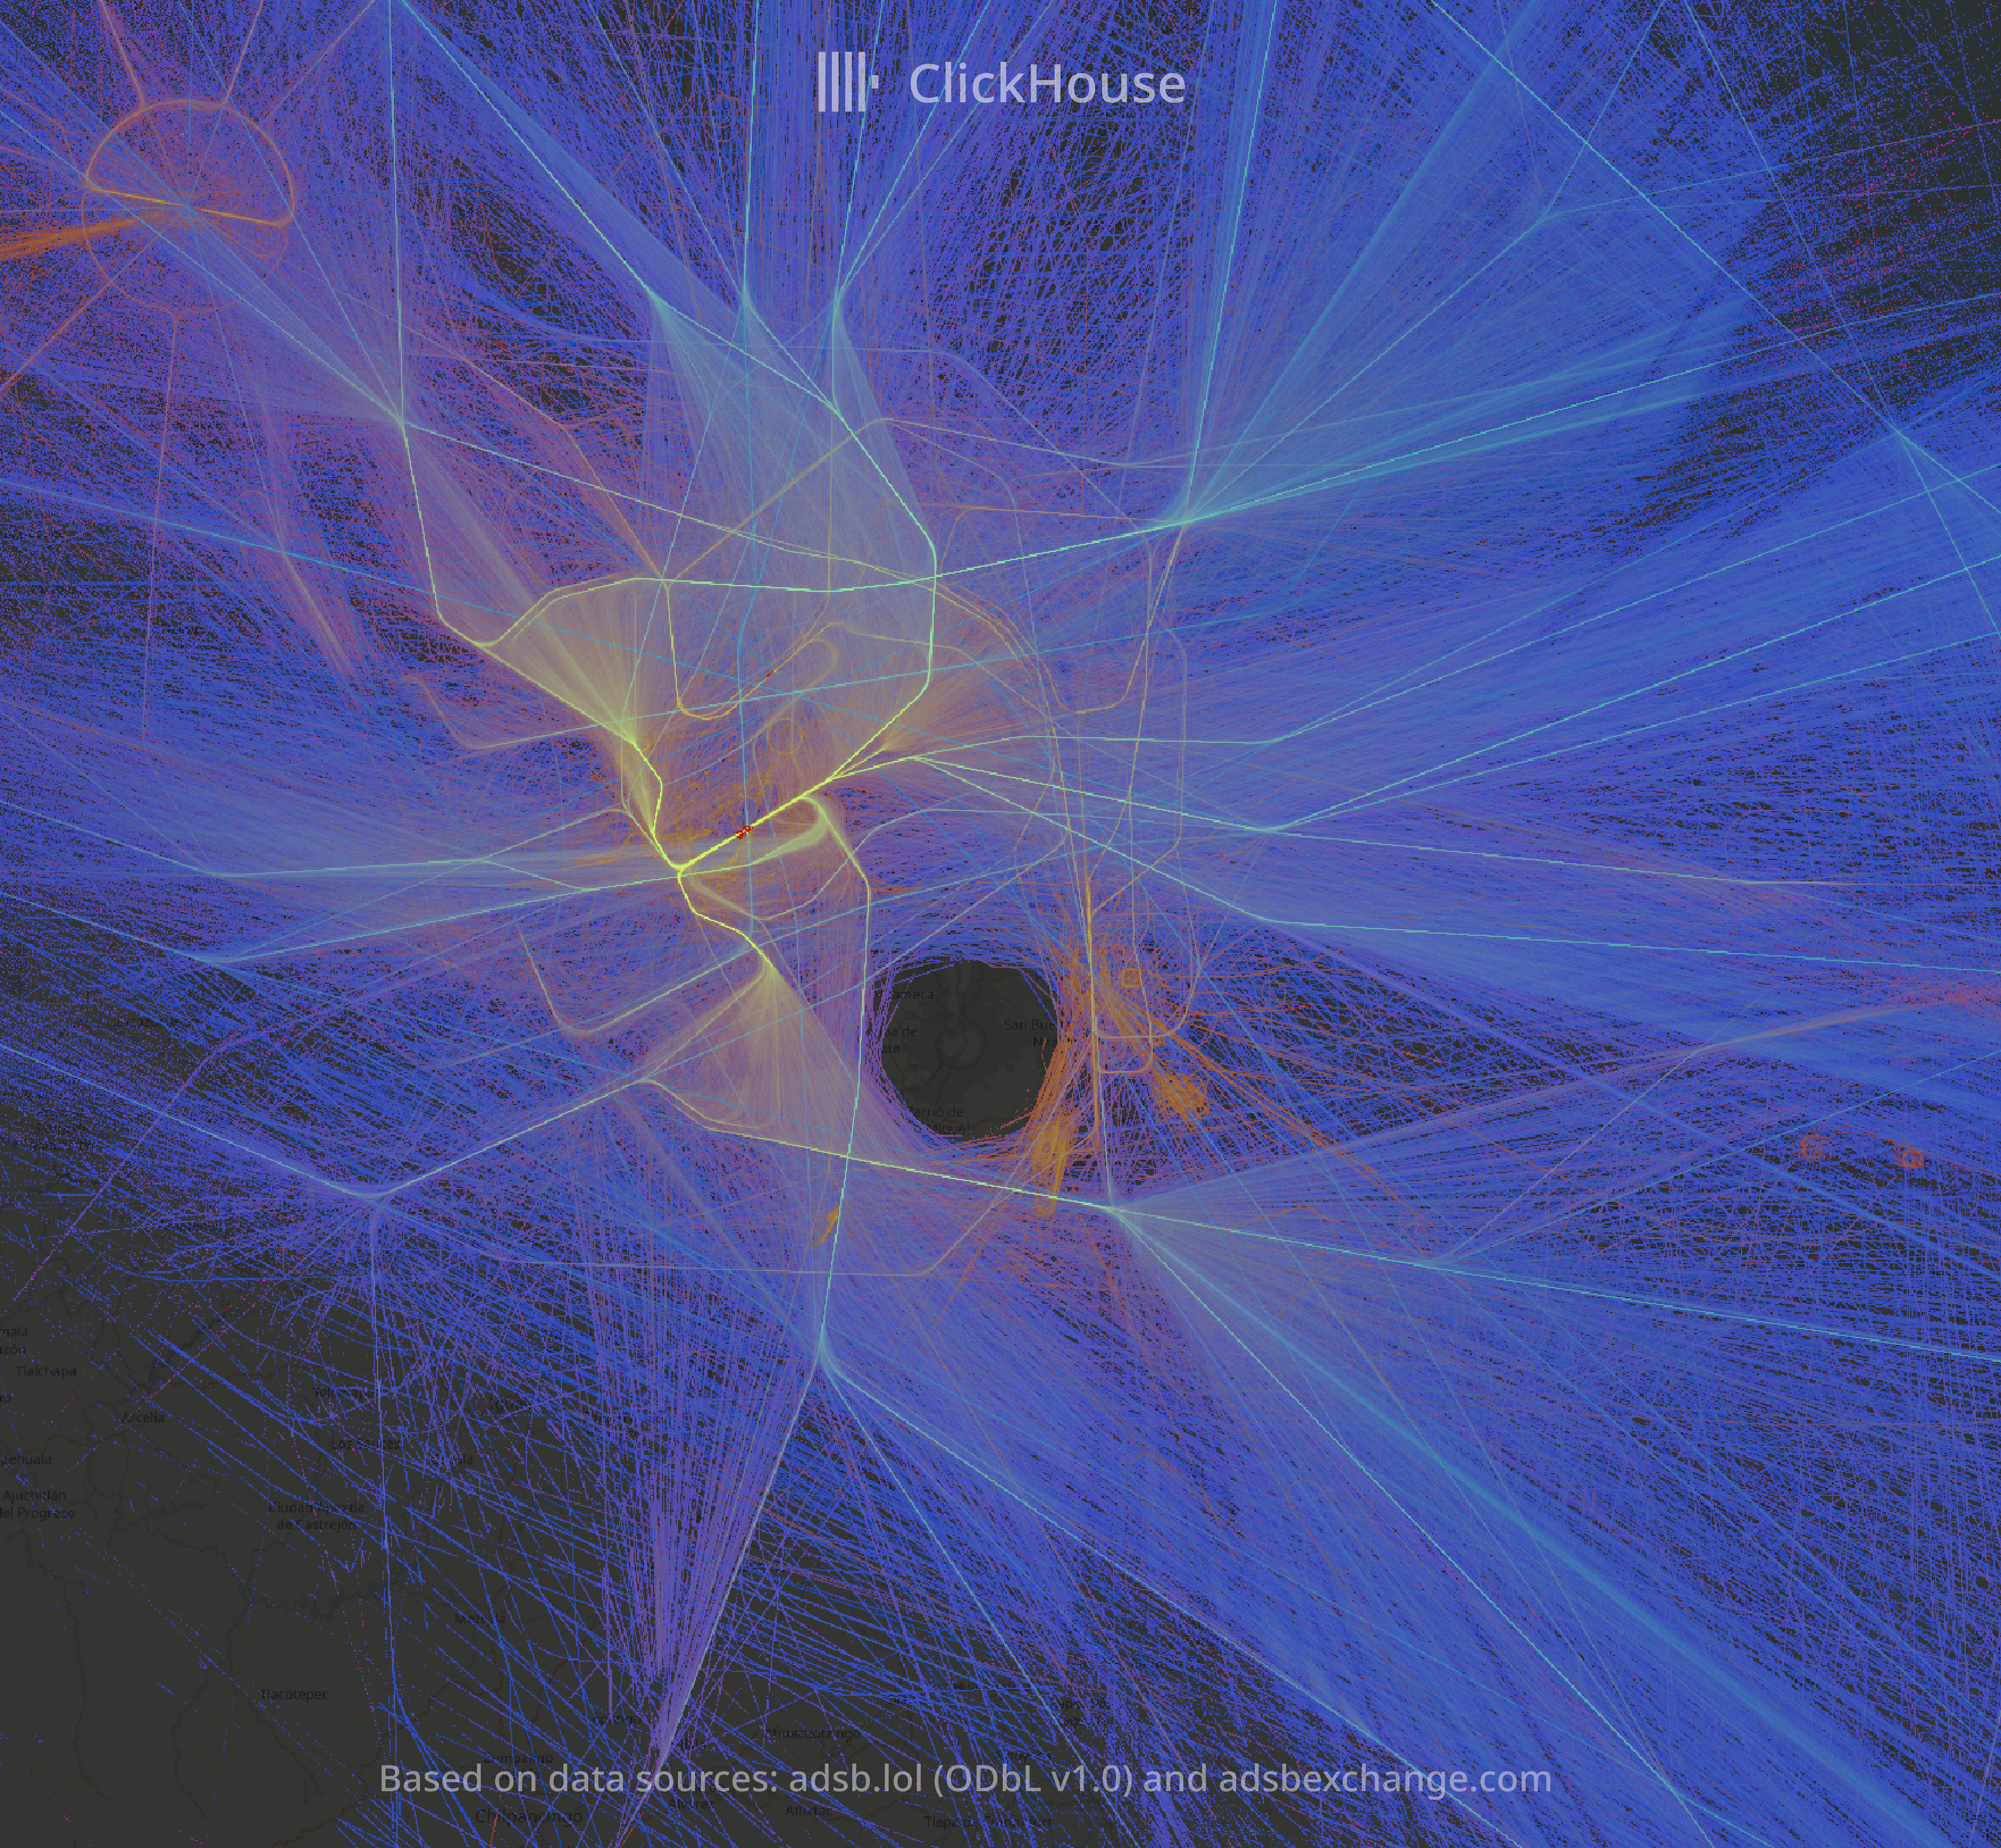
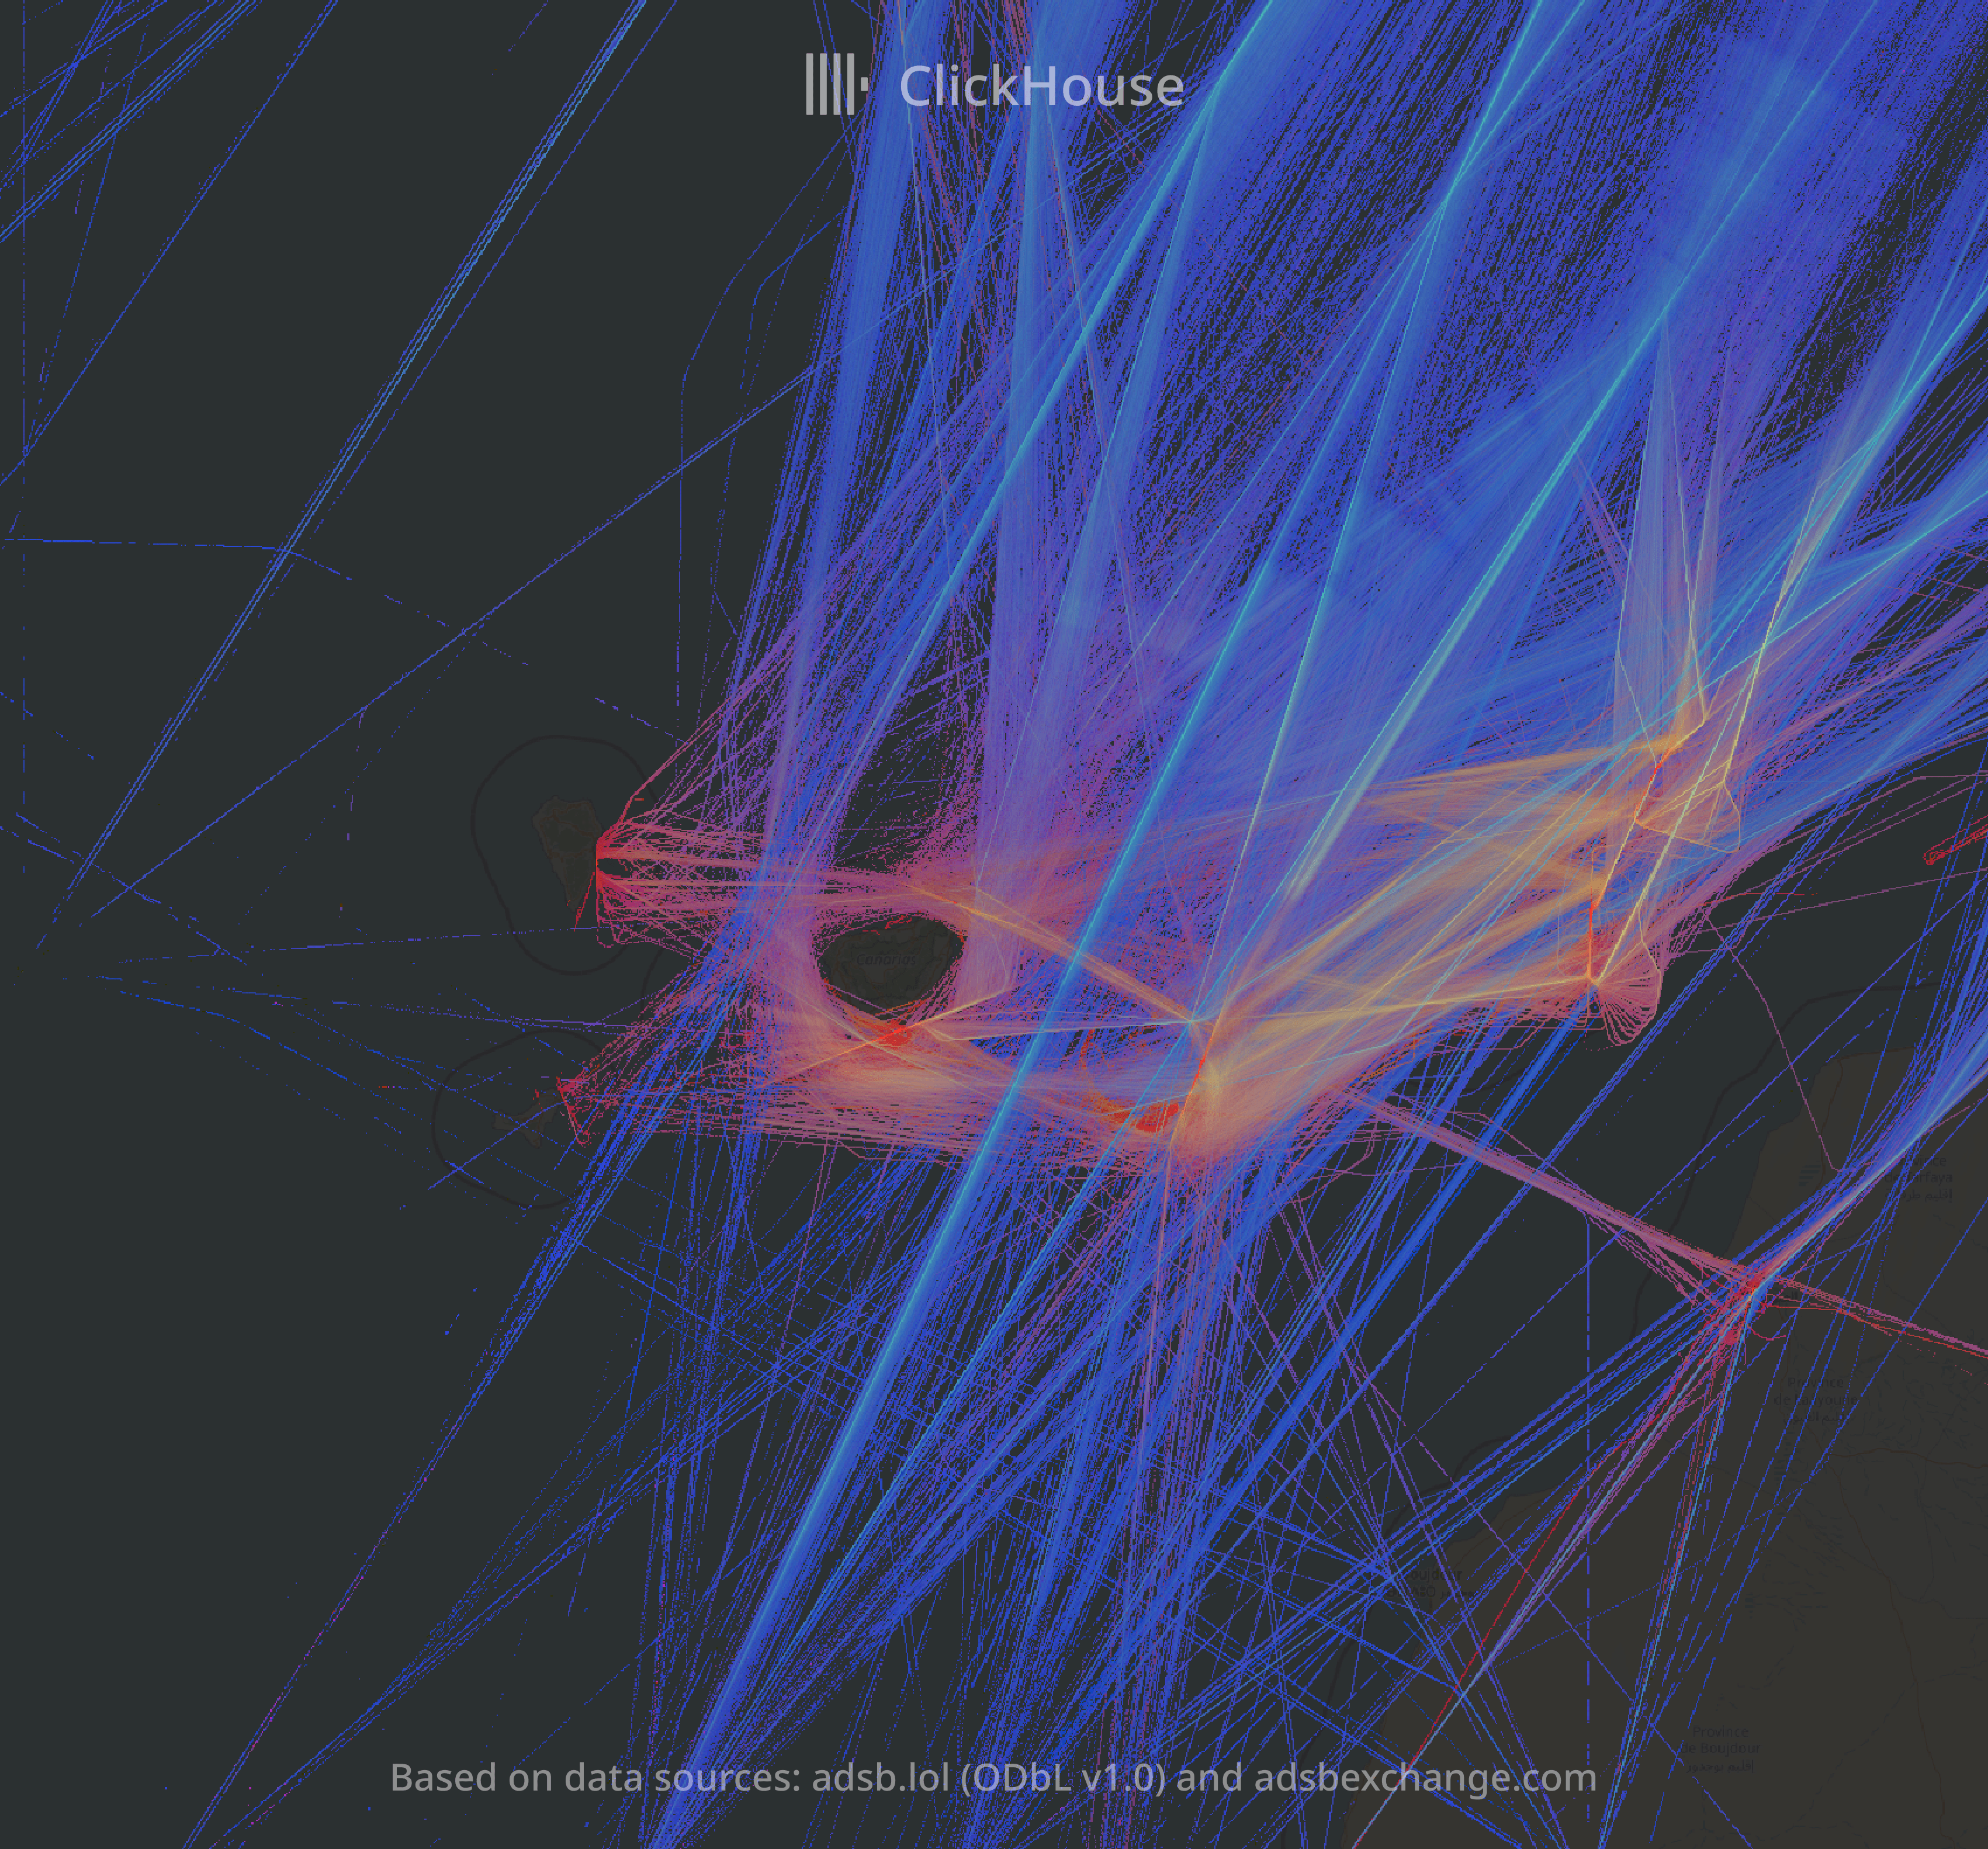
Awesome visualizations
Below we present some of the initial images selected by Alexey. This touches the surface, with the site providing a treasure trove of free wall art!
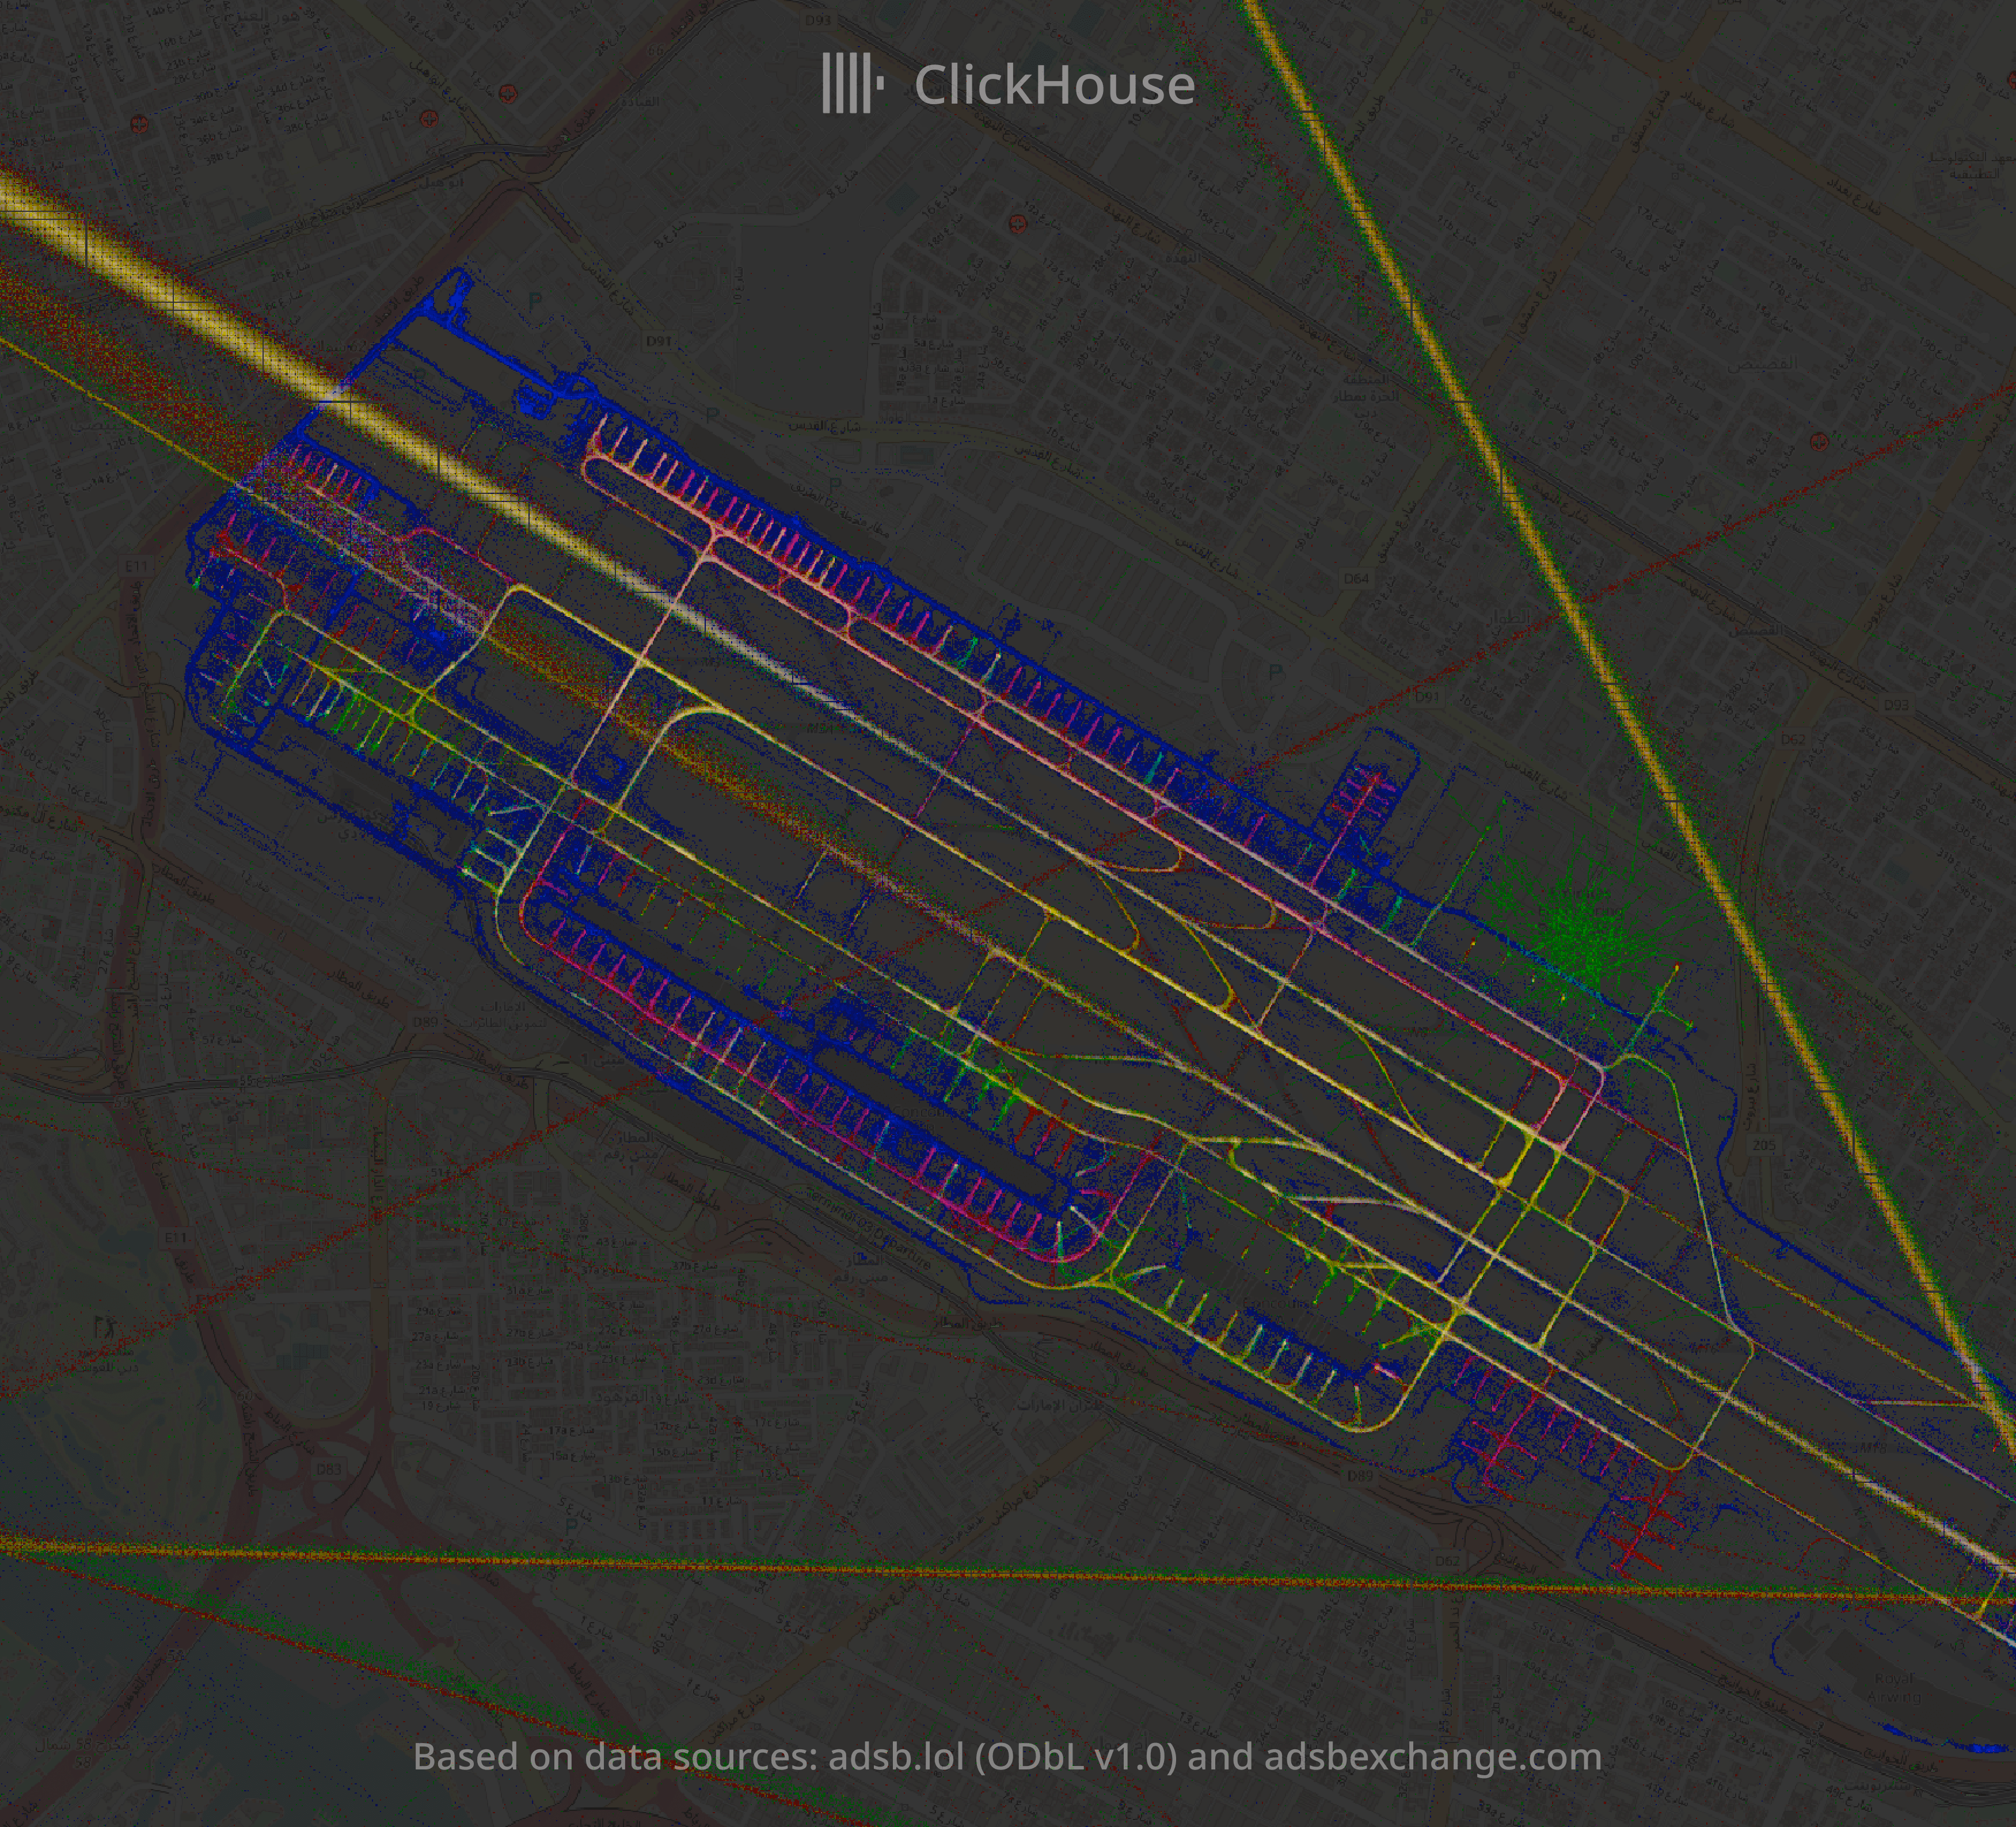
If we zoom into the airport, we can see where the planes are parked and even color them by a manufacturer or an airline:

In Dubai Airport, the green hairball is a hangar of Emirates Engineering where Airbuses are maintained.