Introduction
In this follow-up post about asynchronous inserts, we give guidance and queries for monitoring asynchronous inserts. This can be helpful for validating that everything is working correctly according to your settings. And, especially identifying insert errors that occurred during buffer flushes for asynchronous inserts performed in fire and forget mode.
Asynchronous insert mechanics primer
As a reminder, asynchronous inserts keep the frequency of part creations automatically under control by buffering several (potentially small) inserts server side before a new part gets created. The following diagram visualizes this:
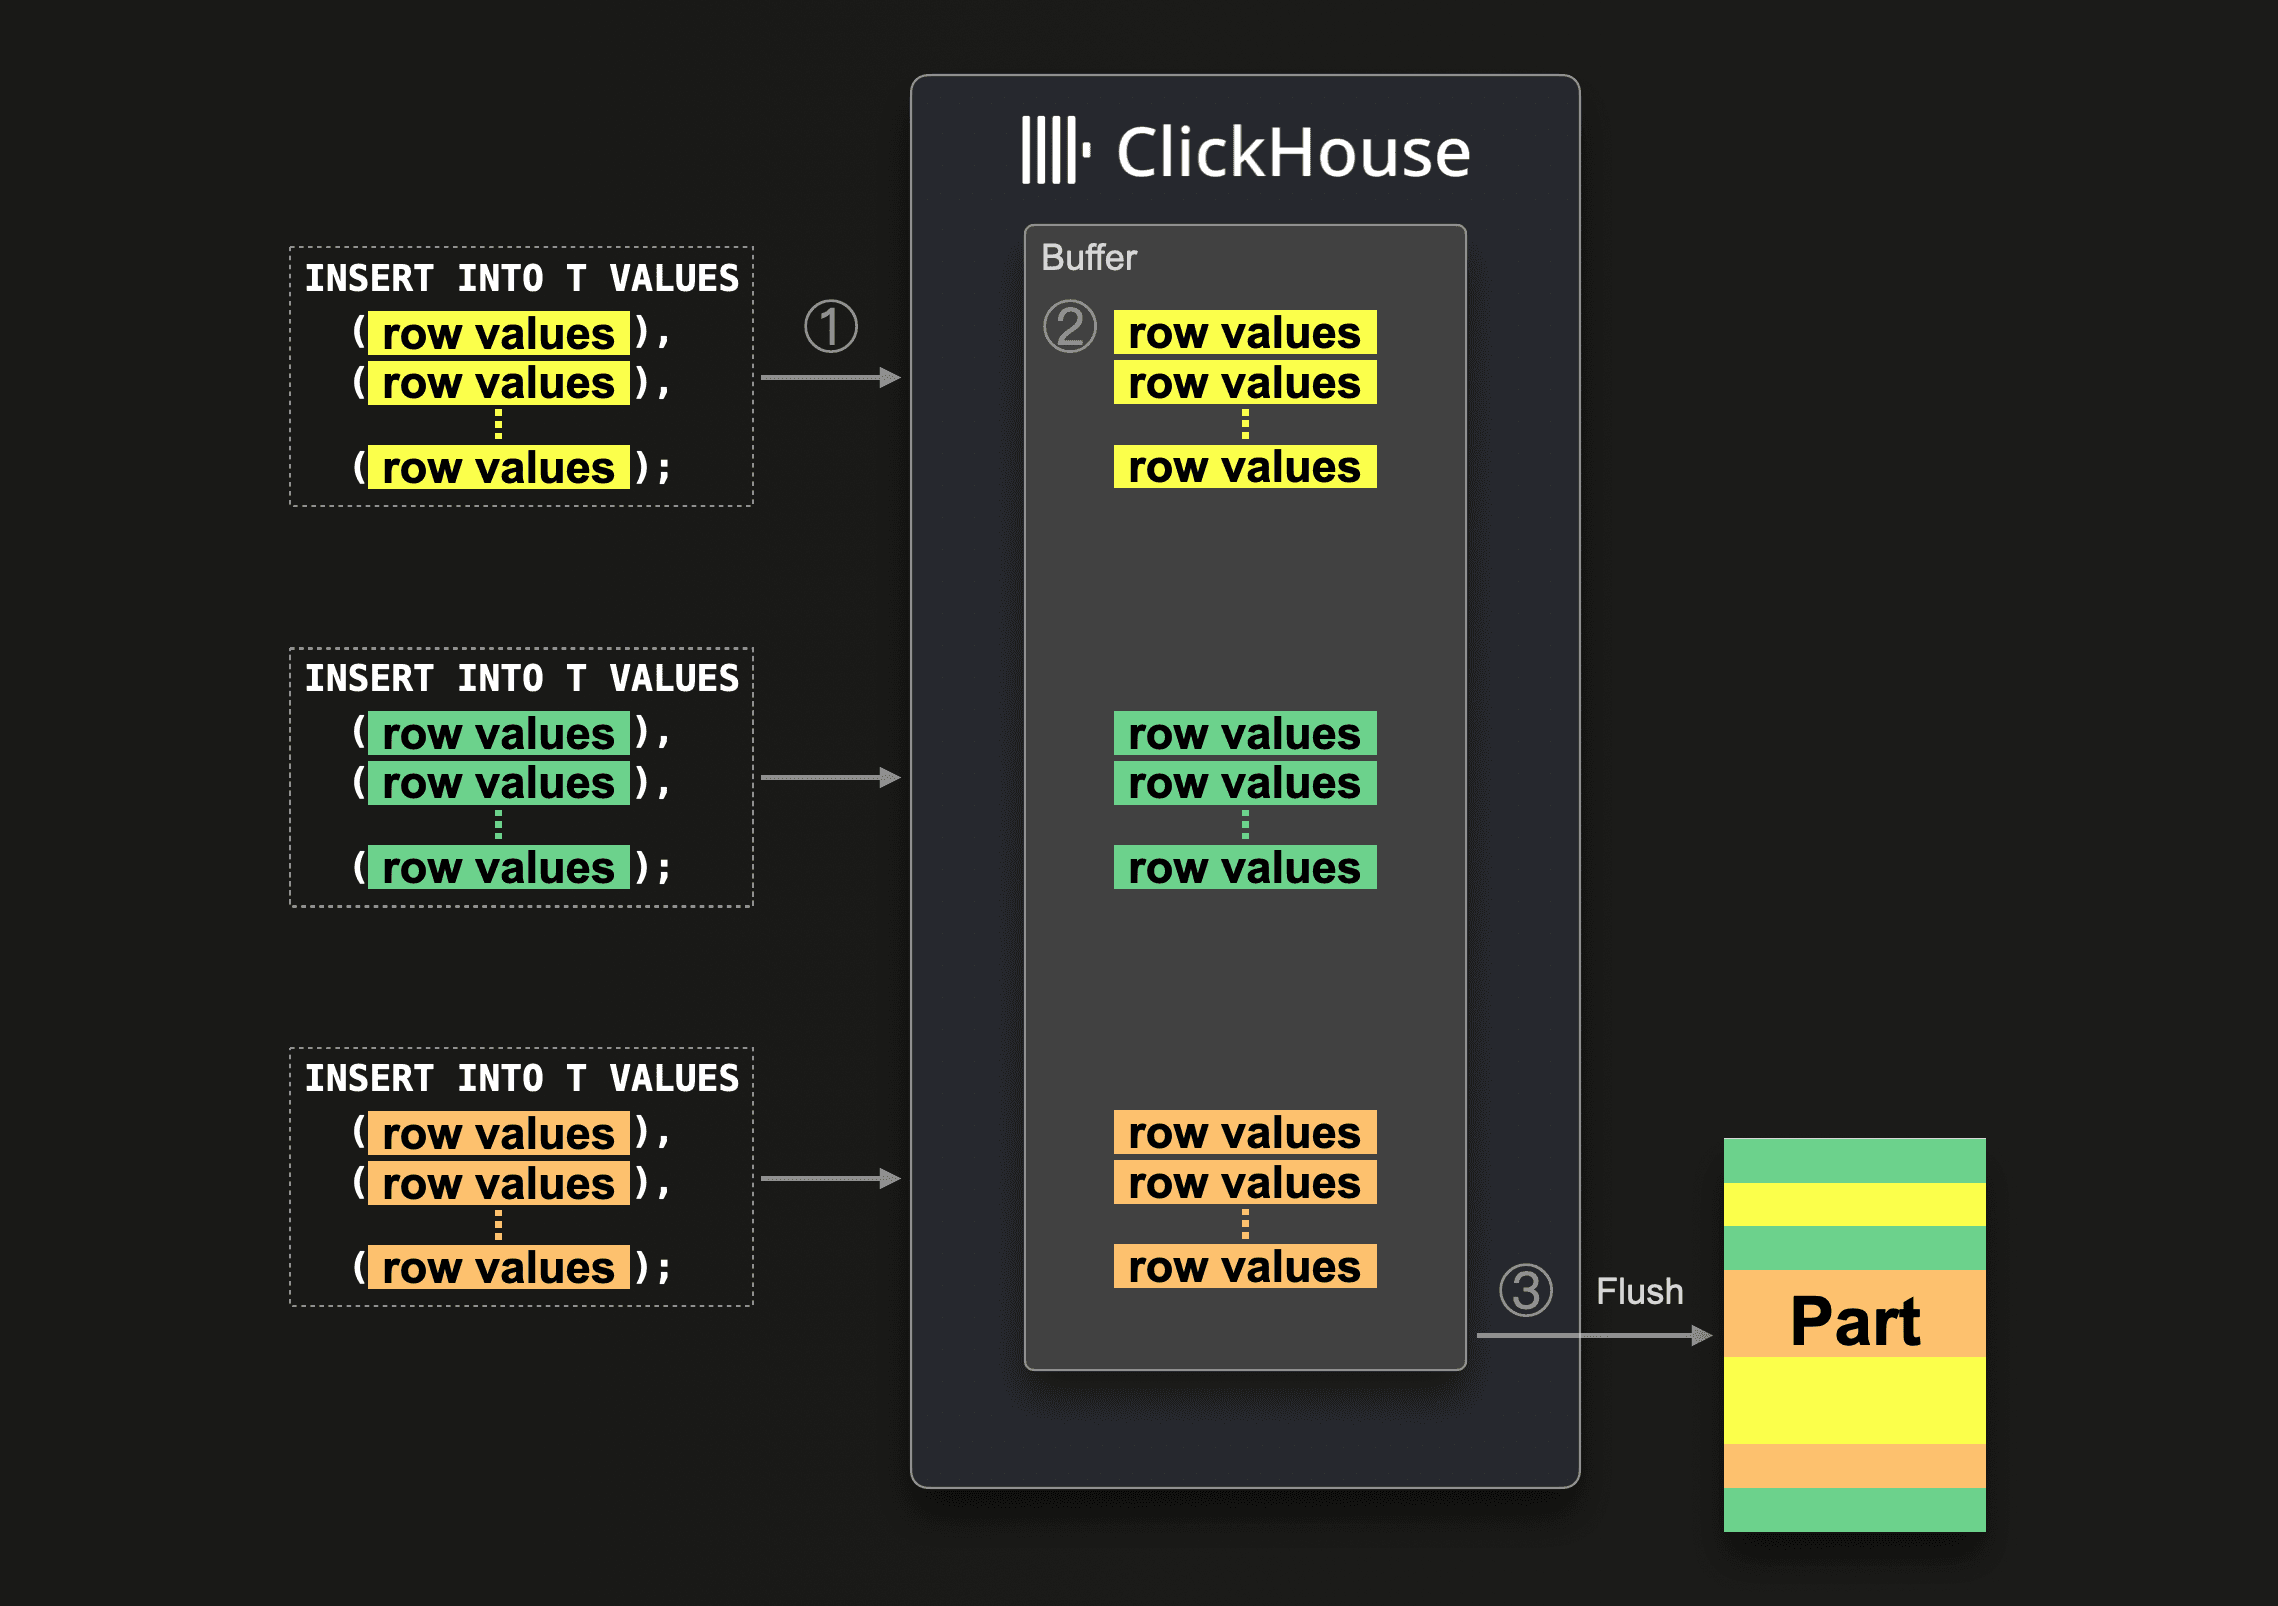 When ClickHouse ① receives an asynchronous insert query, then the query’s data is ② immediately written into an in-memory buffer first. Asynchronously to ①, and only when ③ the next buffer flush takes place, the buffer’s data is sorted and written as a part to the database storage. Before the buffer gets flushed, the data of other asynchronous insert queries from the same or other clients can be collected in the buffer. The part created from the buffer flush will, therefore, potentially contain the data from several asynchronous insert queries. Note that there can be multiple parts being created from a single buffer flush, and there can be multiple buffers in operation at any time.
Relevant system tables
ClickHouse provides SQL-based observability of itself. Each ClickHouse node is constantly monitoring itself and continuously writing metrics, logs, traces, and other observability data into system tables. This allows us to simply use SQL and ClickHouse itself to look deeply under the hood of ClickHouse data processing mechanisms, like asynchronous inserts. In general, system tables are the number one troubleshooting tool for both our core and support engineers.
This diagram lists the system tables containing observability data collected when ClickHouse receives and executes asynchronous inserts:
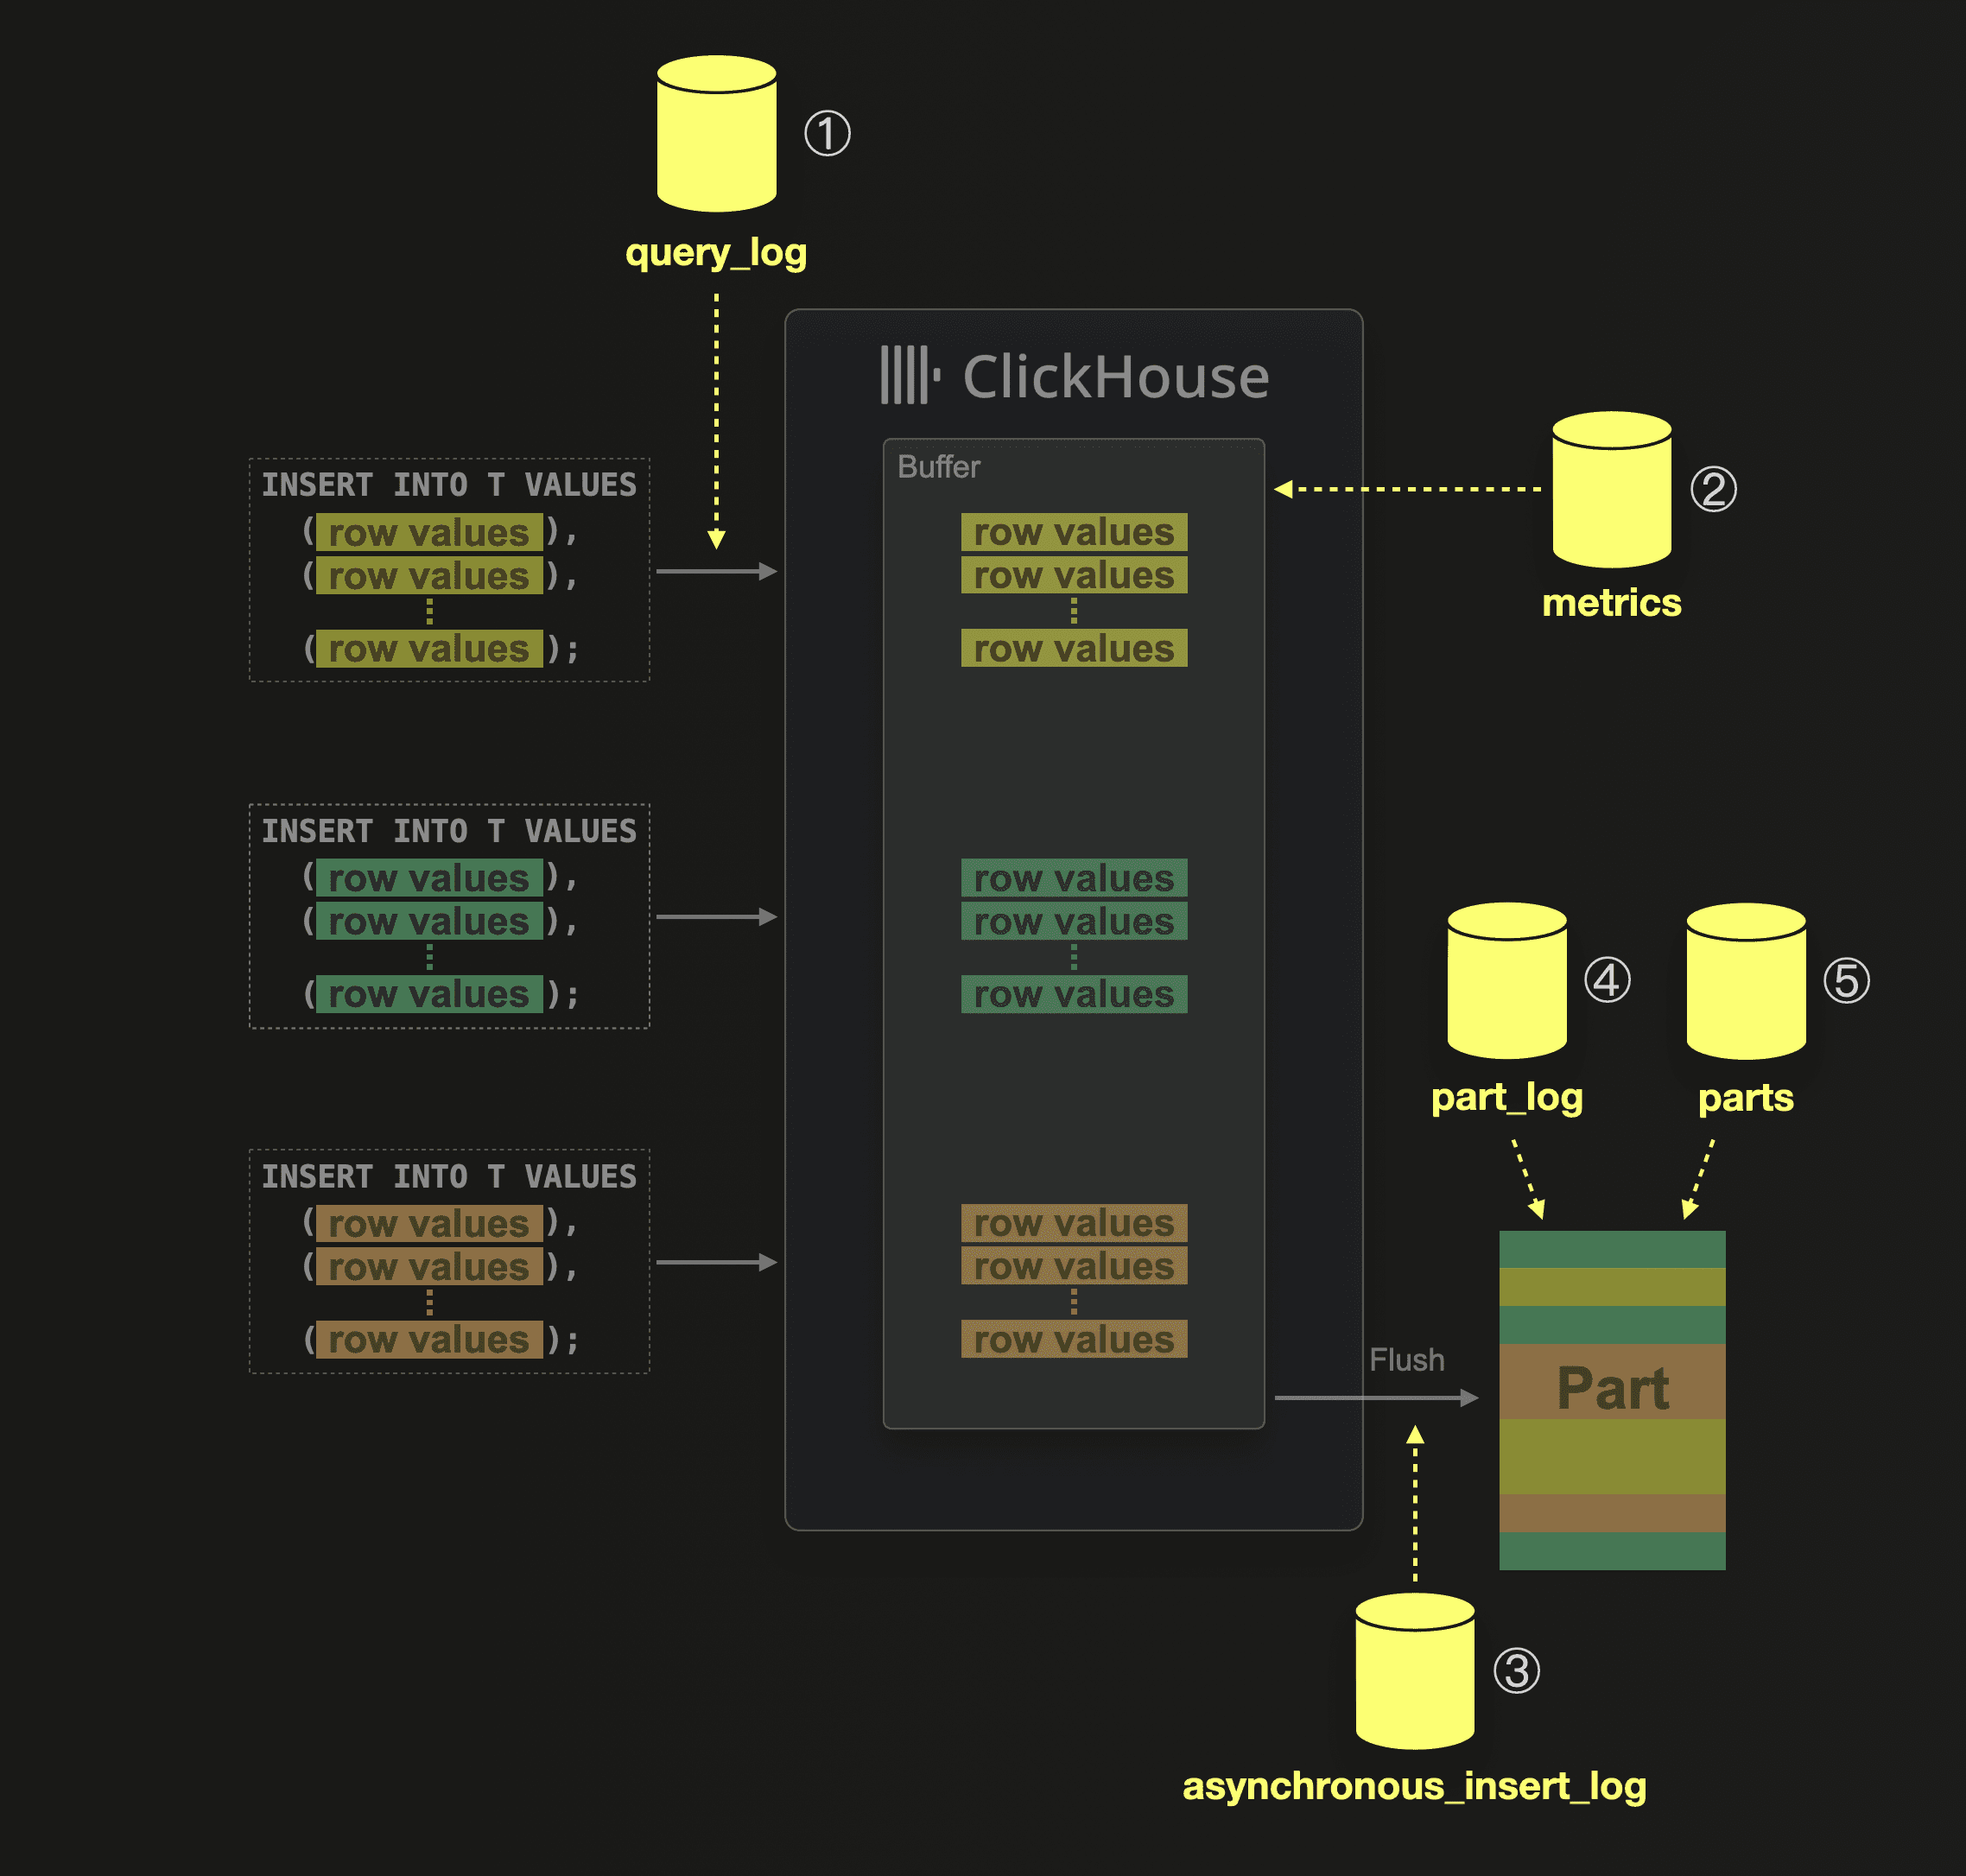 ① When ClickHouse receives and executes an insert query, then this is logged together with execution statistics into the system.query_log table.
② In the system.metrics table, you can check the PendingAsyncInsert metric to get the number of asynchronous insert queries whose data is currently buffered and waiting to be flushed.
③ The system.asynchronous_insert_log table logs all buffer flush events.
④ Whenever a table part is created, then this event is logged in the system.part_log table.
⑤ The system.parts table contains meta information about all currently existing table parts.
In the following sections, we present and describe a few handy queries over these aforementioned system tables for introspecting the execution stages of asynchronous inserts.
Note that these queries are assumed to be executed on a cluster with a specific name by utilizing the clusterAllReplicas table function. If you are not using a clustered version of ClickHouse, you can query the tables directly from your single node.
Queries for introspecting async inserts
To help with debugging, we provide a simple script that creates all of the following queries as handy parameterized views.
Part creations
Remember that the main purpose of asynchronous inserts is to keep the frequency of part creations under control by buffering several (potentially small) inserts ClickHouse-server side, before a new part gets created.
Here is a query over the system.part_log table (joined with system.parts for additional info) that you can use for double-checking the frequency of part creations. Remember that the table rows buffered in the asynchronous insert buffer can potentially contain several different partitioning key values, and therefore, during buffer flush, ClickHouse will create (at least) one new part per table partition.
The query is configured with 4 CTE identifiers (db_name, table_name, last_x_minutes, and last_m_parts_per_node_per_partition). The parameterized view monitor_parts has the same identifiers as parameters.
The query lists, for a specific database and table, the latest m newly created parts during the last x minutes per cluster node (n) and per table partition (ptn) the creation times (write), contained rows and compressed size on disk.
For convenience, we also show (prev) for each part how much time has passed since a previous part was created on the same cluster node for the same table partition.
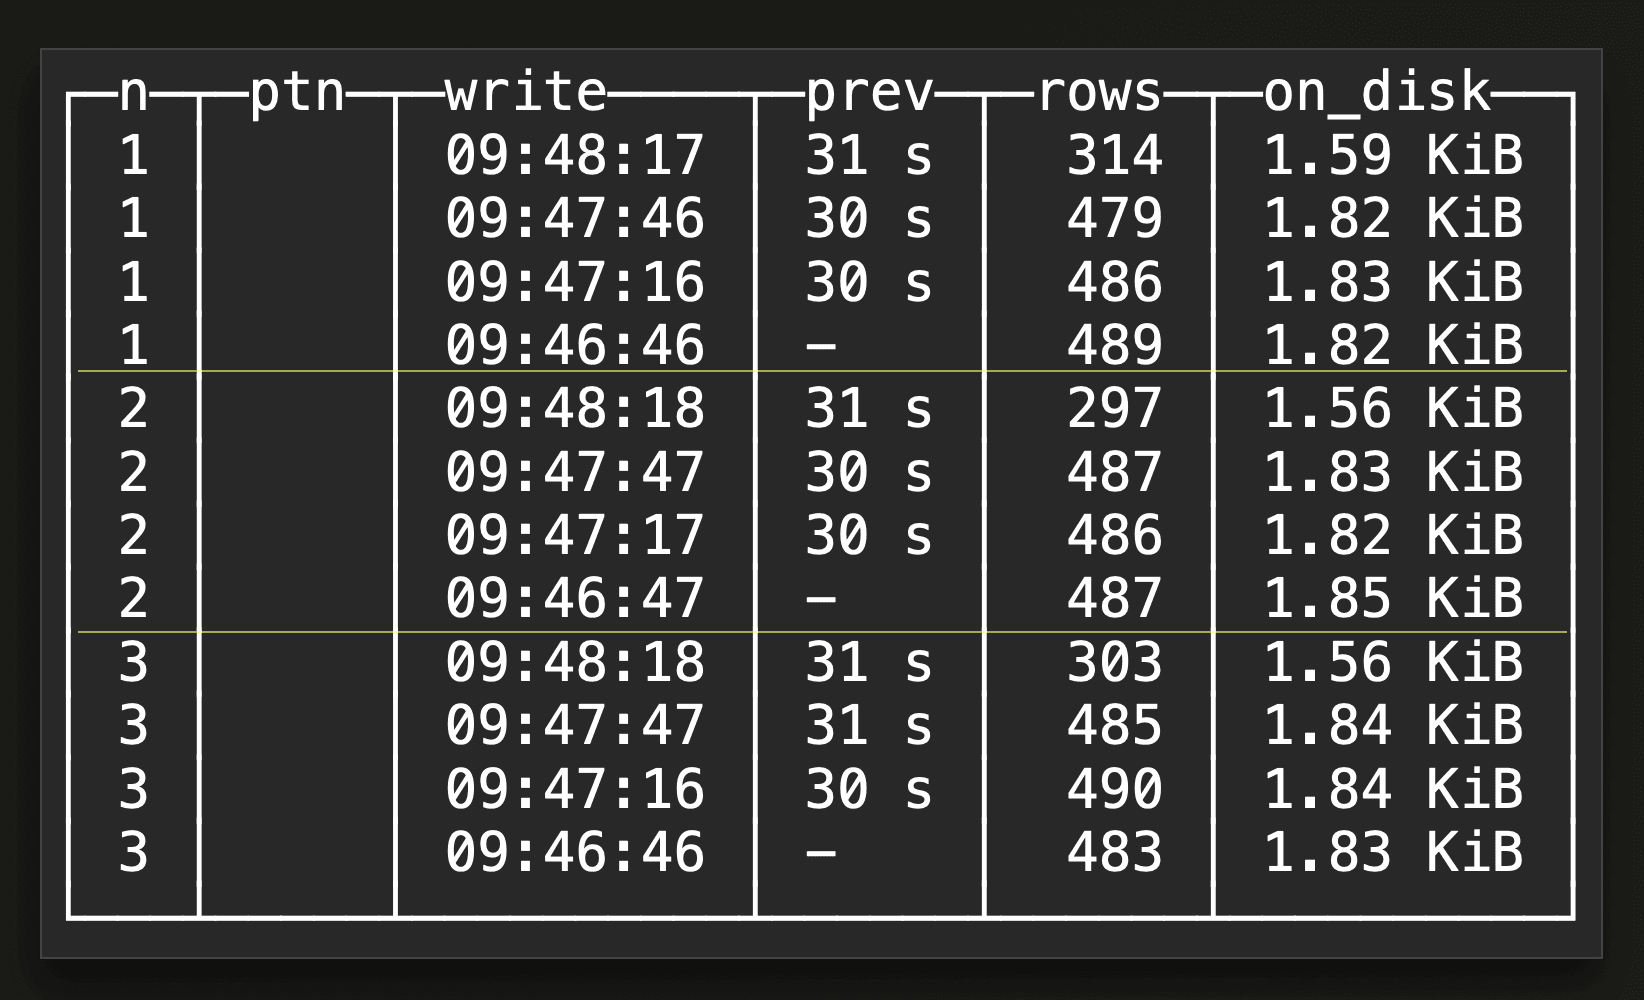
This is an example result for a SELECT * FROM monitor_parts(db_name='default', table_name='upclick_metrics’, last_x_minutes=10, last_m_parts_per_node_per_partition=4) view query:
 The result shows the latest 4 created parts per cluster node (on a three-node ClickHouse Cloud service) and per table partition within the last 10 minutes. As our example target table doesn’t use a partitioning key, the
 ptn column is empty. We can see that on each of the three cluster nodes, a new part was created every 30 seconds. That was exactly how we configured asynchronous inserts in one of our benchmark runs with a 30 seconds buffer flush time. Remember that the buffer exists per node.
Buffer flushes
In case the result of the previous query doesn’t show the expected part creation frequency for asynchronous inserts, a first debugging step would be to check the frequency of buffer flushes.
A query can be found here, which joins the system.asynchronous_insert_log and system.query_log tables. Remember that there is one separate buffer per cluster node and per insert query shape (the syntax of the insert query excluding the values clause / the data) and per settings.
The query is configured with 4 CTE identifiers (db_name, table_name, last_x_minutes, and last_m_flushes_per_node_per_shape_per_settings). The parameterized view monitor_flushes has the same identifiers as parameters.
The query lists, for a specific database and table, information about the latest m buffer flushes during the last x minutes per cluster node (n) per query shape (q) id per query settings (s) id. For each buffer flush, we list the flush time, the number of rows, and the amount of uncompressed data flushed to disk. For convenience, we also show (prev) for each buffer flush how much time has passed since a previous flush took place on the same node for the same query shape and settings. Plus, we show one concrete sample_query per insert query shape id and the sample_settings corresponding to a settings id.
This is an example result for a SELECT * FROM monitor_flushes(db_name='default', table_name='upclick_metrics’, last_x_minutes=10, last_m_flushes_per_node_per_shape_per_settings=4) view query:
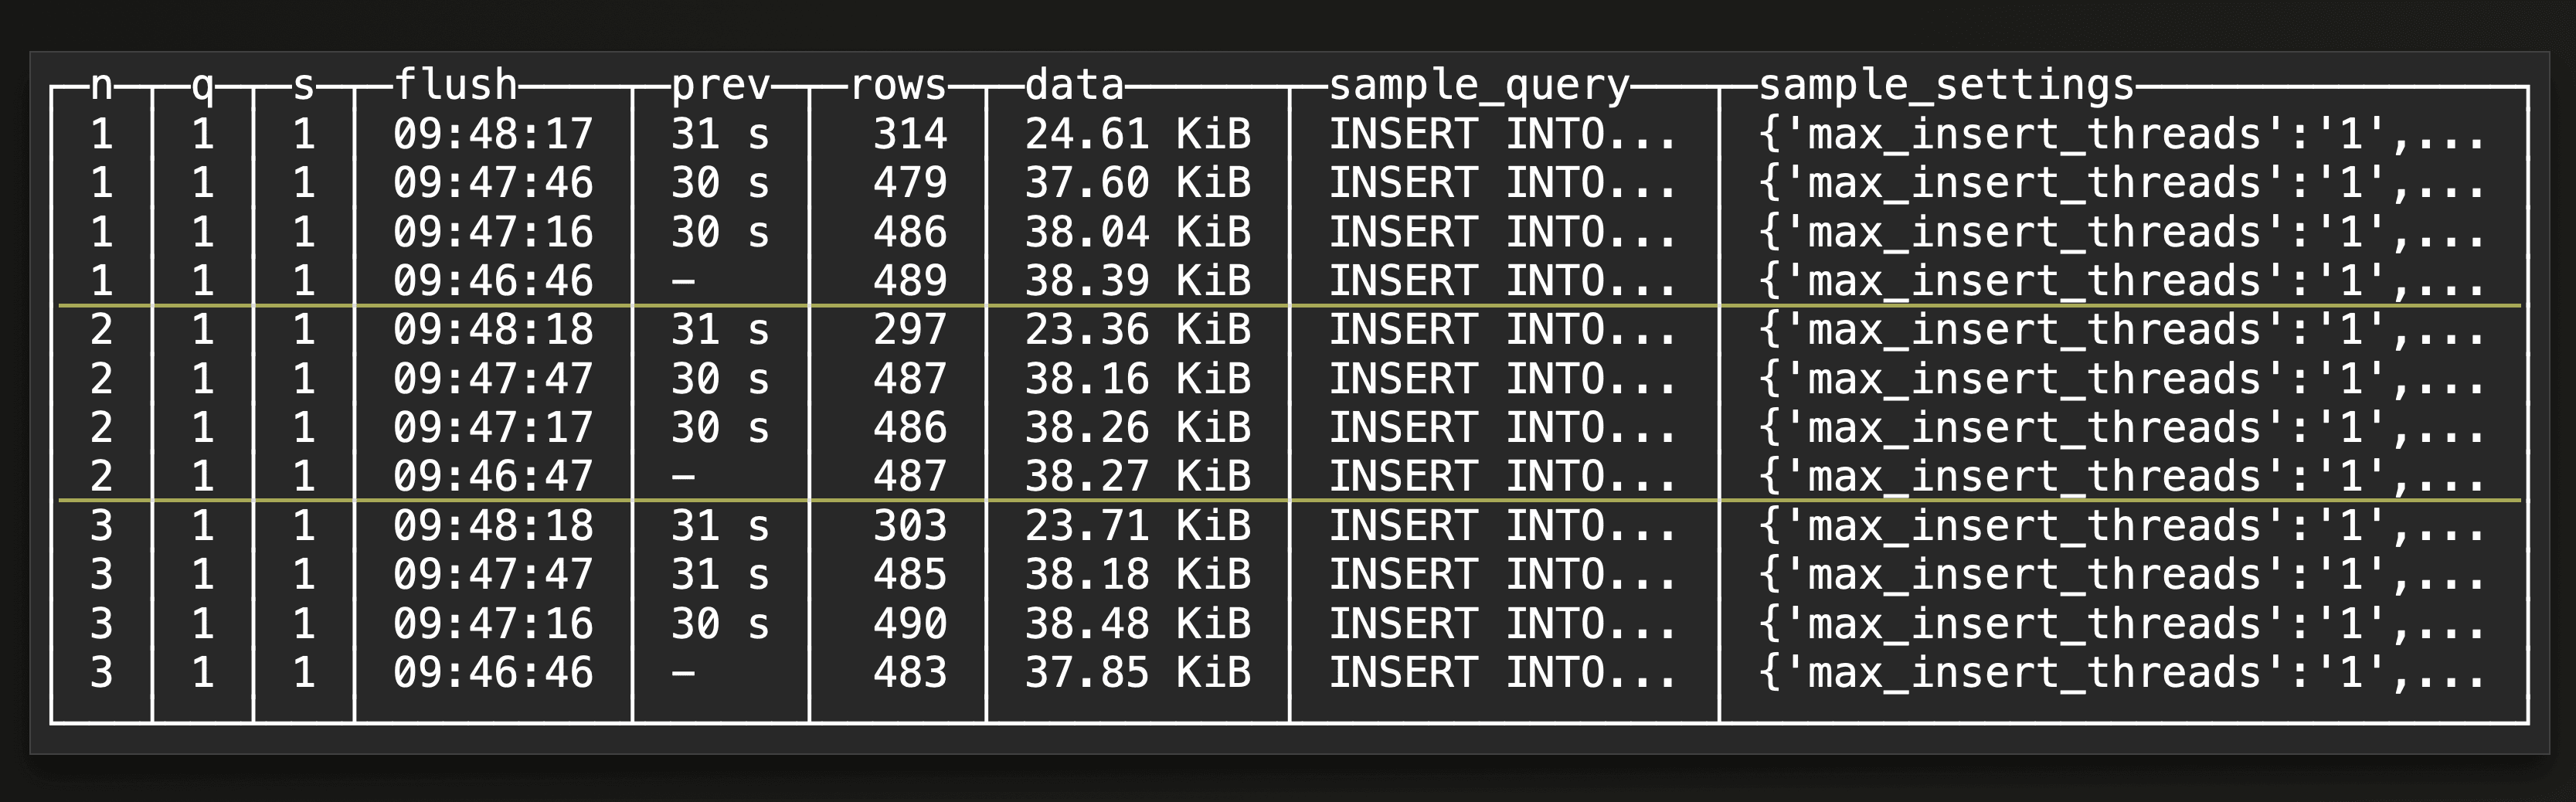 The result shows the latest 4 buffer flushes per cluster node (on a three-node ClickHouse Cloud service) and per query shape and settings within the last 10 minutes. We can see that on each of the three cluster nodes, a buffer flush took place every 30 seconds. That matches one of our benchmark runs with a 30-second buffer flush timeout. The flush times correlate with the part creation times returned from the previous query. Note that all insert queries have the same shape and settings as indicated in the example result above.
Insert errors during buffer flushes
Insert errors can occur during buffer flushes. With the default asynchronous insert return behavior, the sender of the query gets a detailed error message returned instead of an acknowledgment. With the fire and forget mode, however, the original insert into the buffer for that query gets successfully acknowledged to the sender, regardless of whether the insert into the target table during a later buffer flush actually succeeds or not.
Here is a query for finding out about insert errors during buffer flushes in hindsight. The query runs over the system.asynchronous_insert_log table and is configured with 3 CTE identifiers (db_name, table_name, and last_x_minutes). The parameterized view monitor_flush_errors has the same identifiers as parameters.
The query lists per cluster node (n) and error status and exception message the latest buffer flush times within the last x minutes during which the exception took place. Together with the query_id of one of the queries whose buffered data caused the insert error during the buffer flush. You can use this id for querying (or joining) the system.query_log table for getting more information about the specific query.
This is an example result for a SELECT * FROM monitor_flush_errors(db_name='default', table_name='upclick_metrics’, last_x_minutes=10) view query:
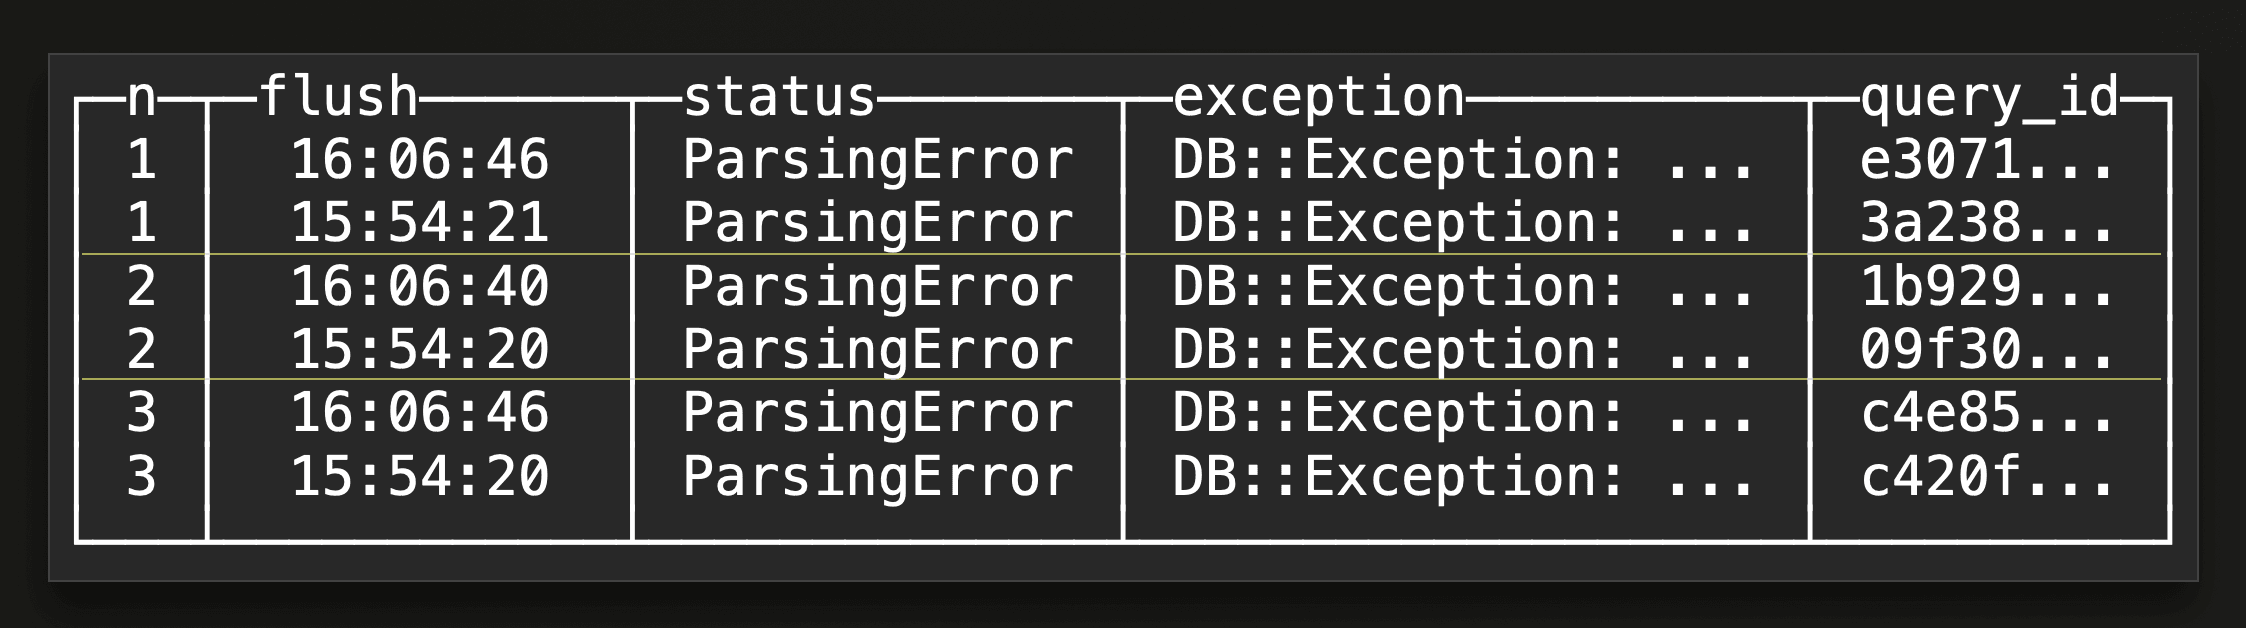 The result shows that some parsing errors happened during two buffer flushes per cluster node (on a three-node ClickHouse Cloud service) within the last 10 minutes.
Pending flushes
Lastly, here is a query that checks the current value of the PendingAsyncInsert metric in the system.metrics table for getting the number of asynchronous insert queries whose data is currently buffered and waiting to be flushed per cluster node.
This is an example query result:

Scenarios
In this section, we are going to use some of the queries from the previous section to identify the root cause of buffer flush and part write frequencies.
Simple and straightforward
When no partitioning key is used in the target table, and each insert query has the same shape and settings, we will see that the buffer gets flushed according to the configured flush threshold settings, and there is a 1:1 relationship between buffer flushes and parts written to disk. This occurs per node. The following two example query results for the buffer flushes and part creations queries demonstrate this:
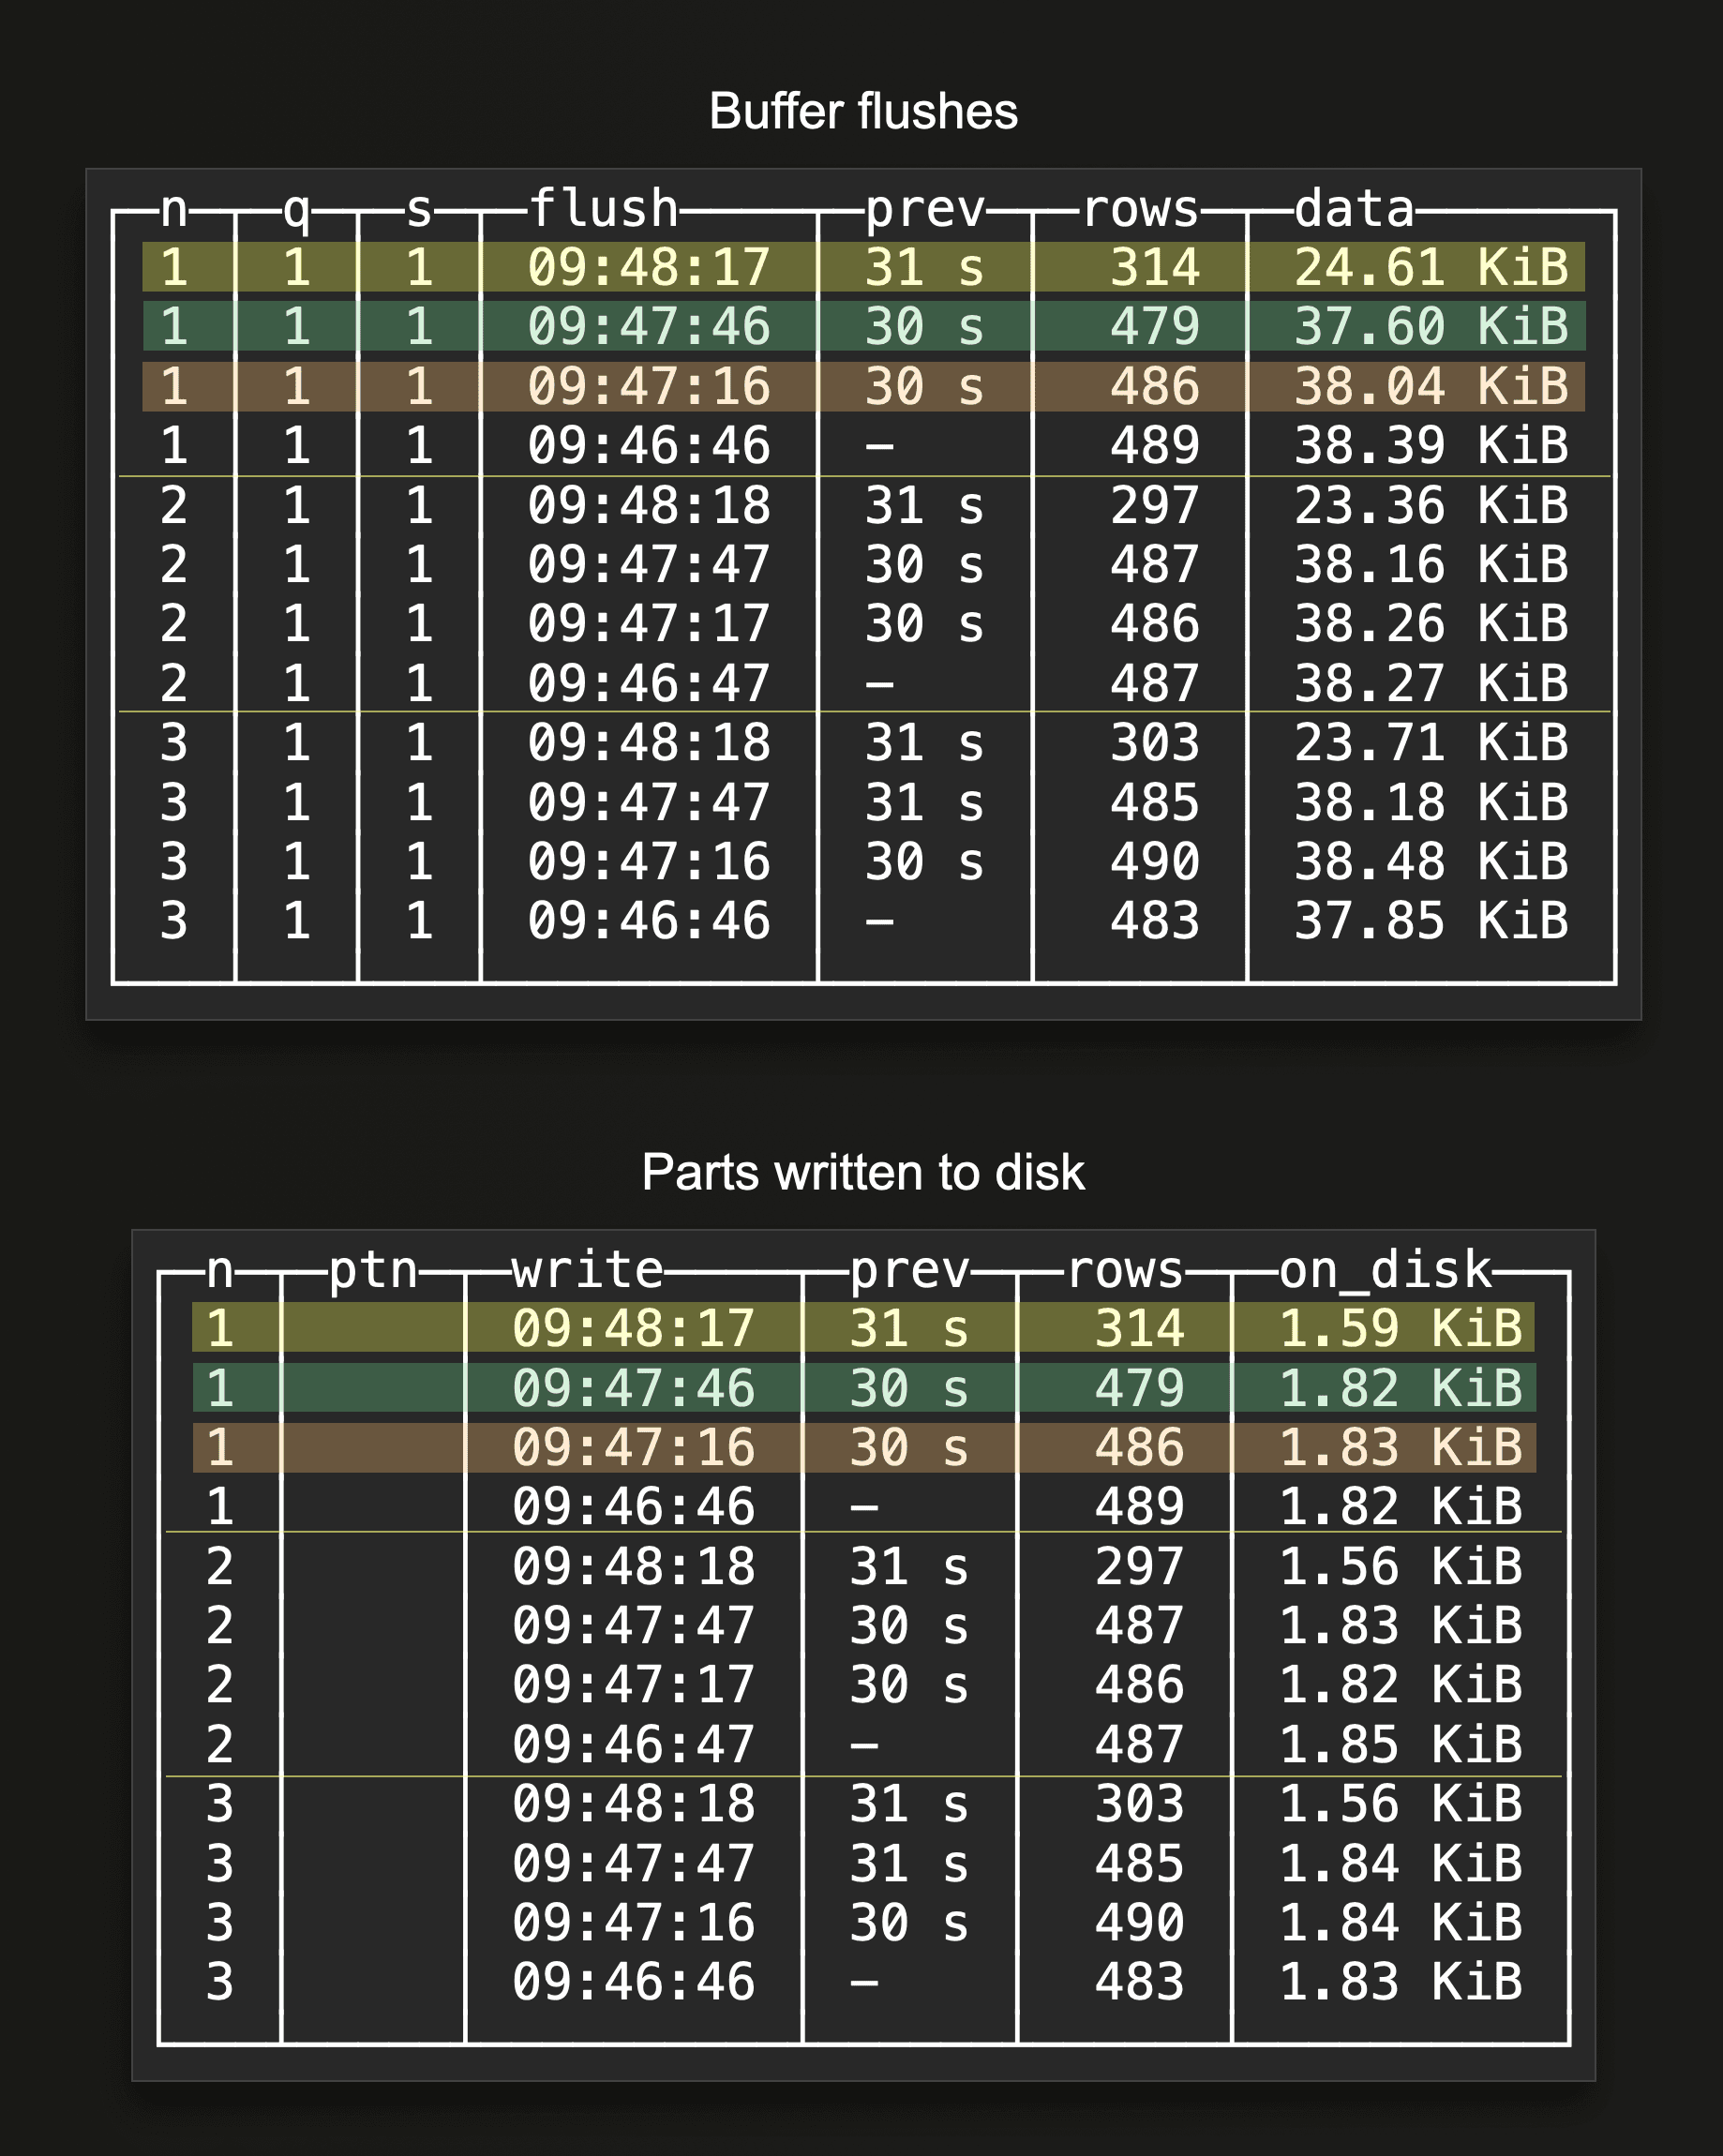 On a three-node ClickHouse Cloud service, we configured asynchronous inserts in one of our benchmark runs with a 30-second buffer flush time. We see that there is a buffer flush every 30 seconds on each node, resulting in a part being written to disk every 30 seconds per node. See the highlighted rows in the two query results above, where the same color is used for corresponding buffer flushes and part creations.
Multiple partitioning keys
When a partitioning key is used in the target table, then there is generally no longer a (per node) 1:1 relationship between buffer flushes and parts written to disk. Instead, more than one part can be created per buffer flush. The next two example query results show this:
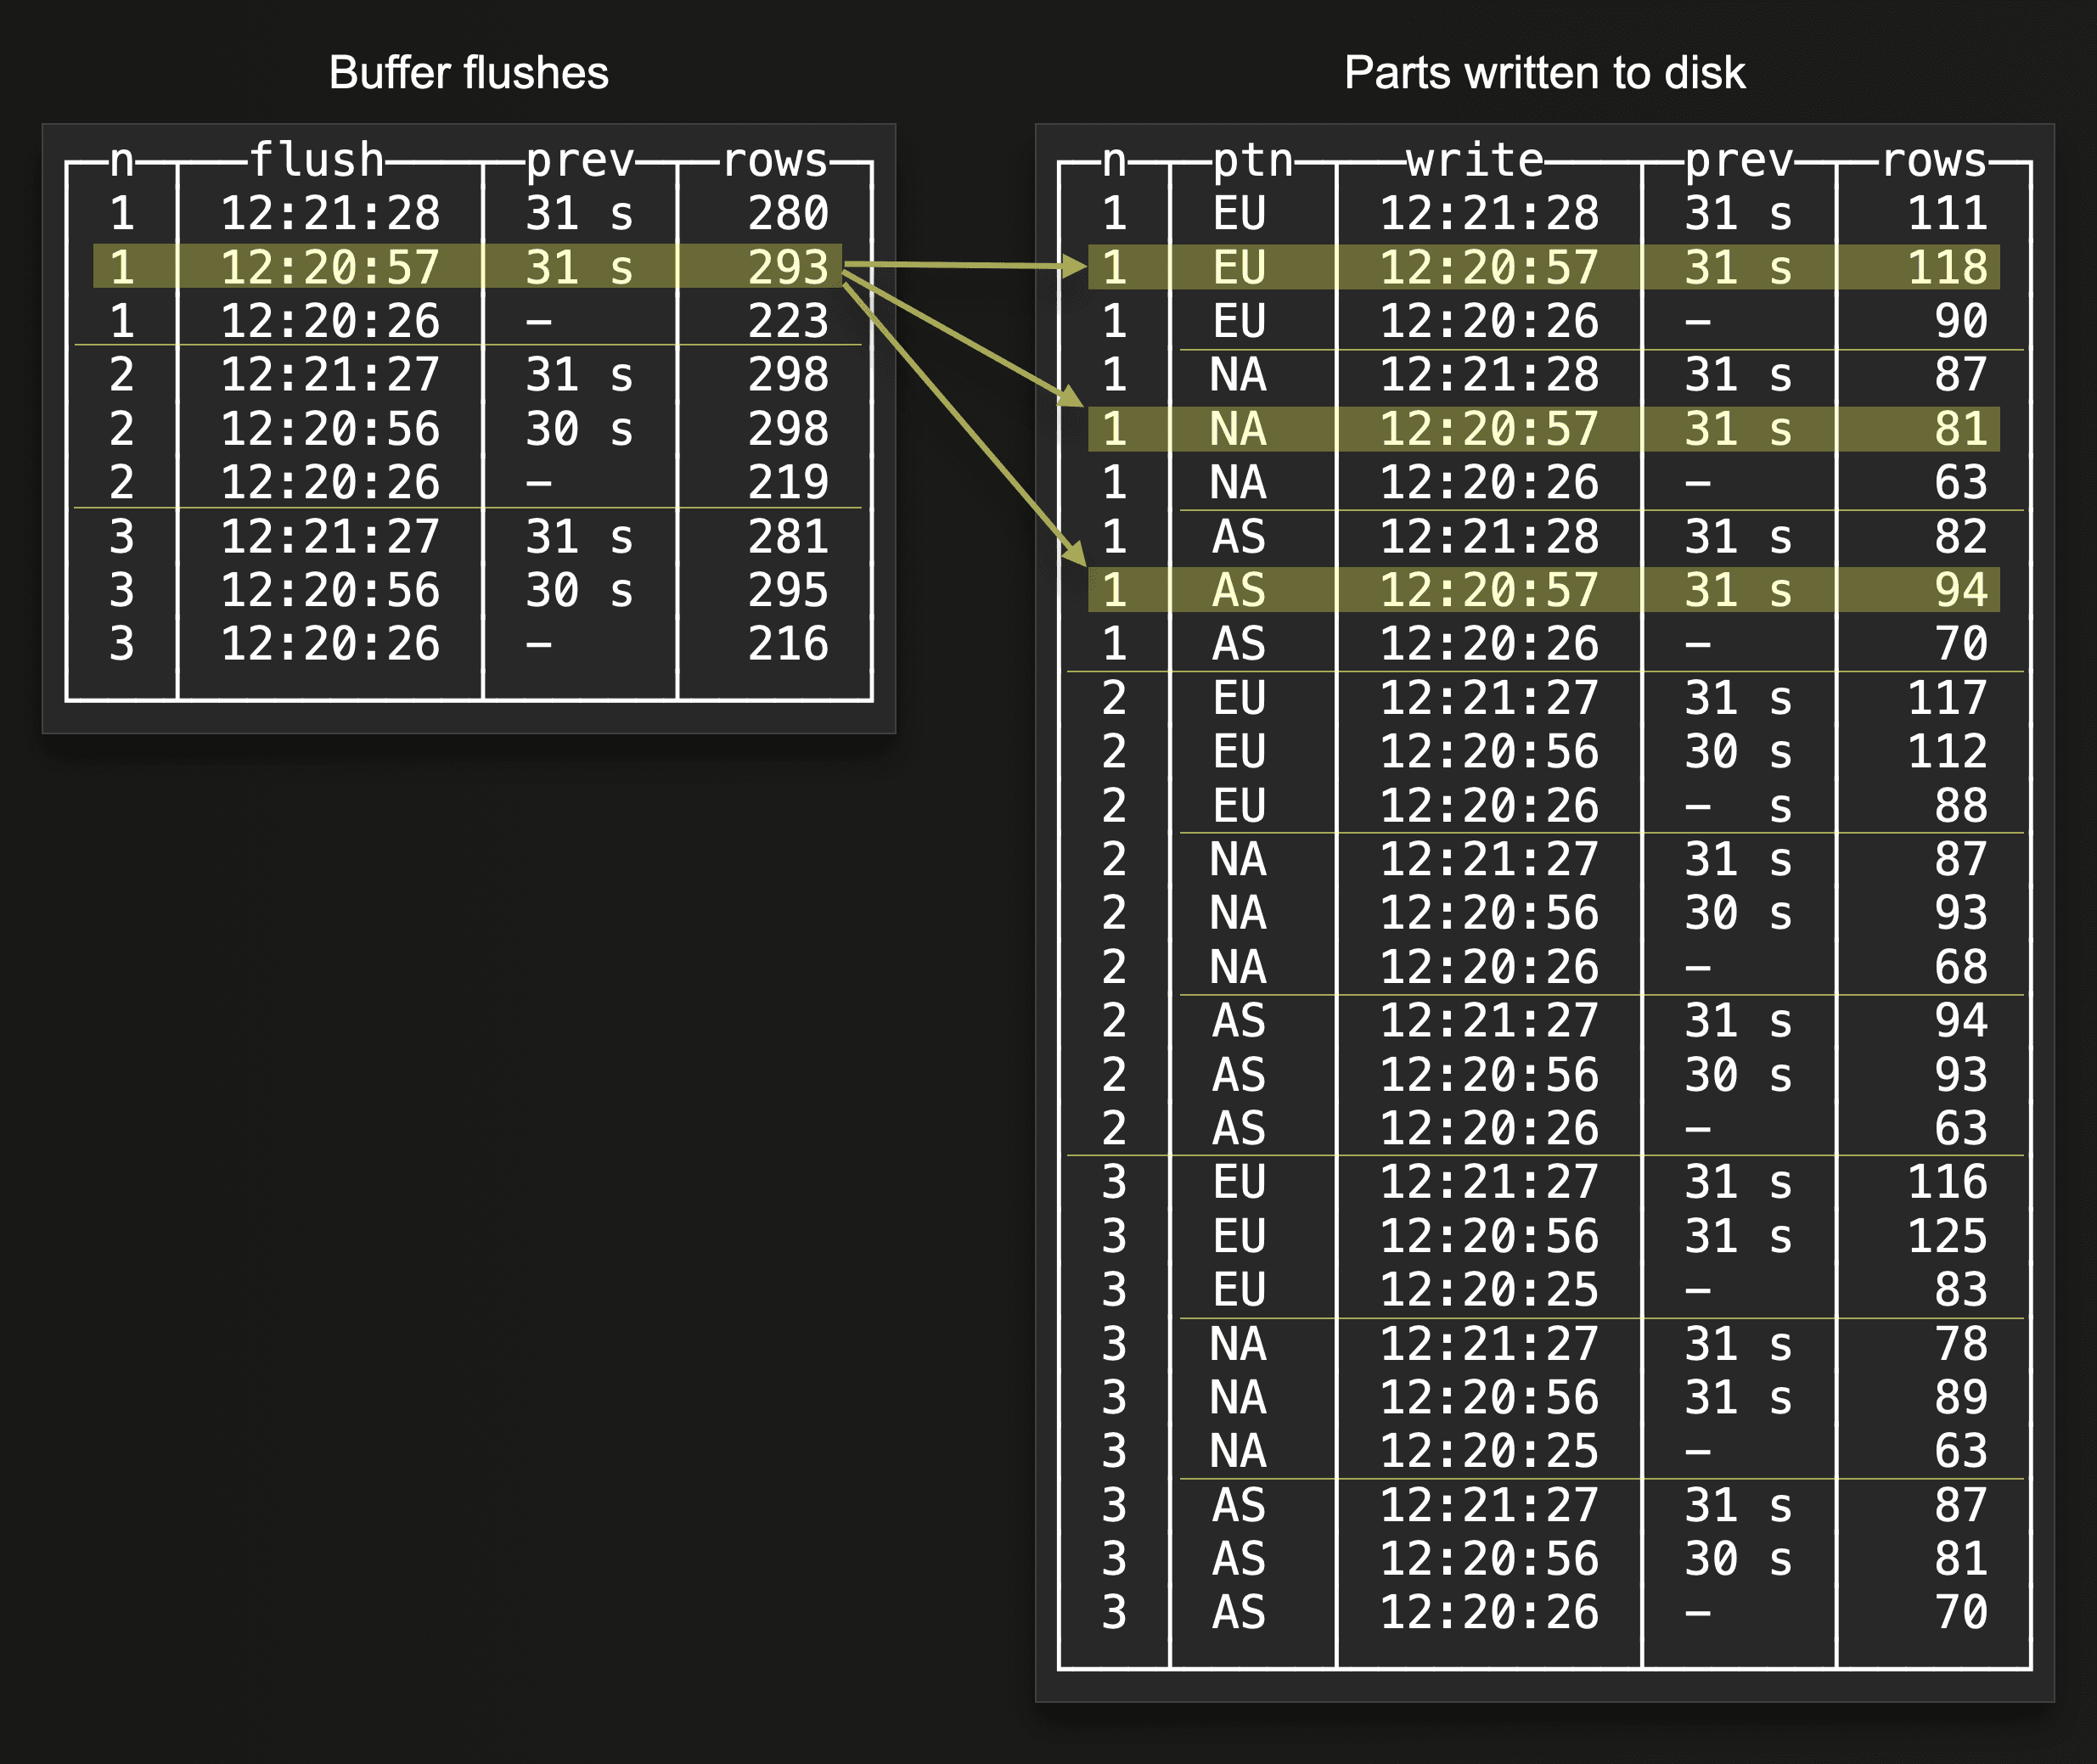 The highlighted rows in the two query results above indicate that a single buffer flush on one node resulted in three parts being written to disk on the same node at the same time. Because the rows in the buffer contained three different partitioning key values when the buffer was flushed.
Multiple query shapes
Because there is one separate buffer per insert query shape (and per node), more than one buffer flush can potentially occur per configured buffer flush threshold on a single node. These two example query results sketch this:
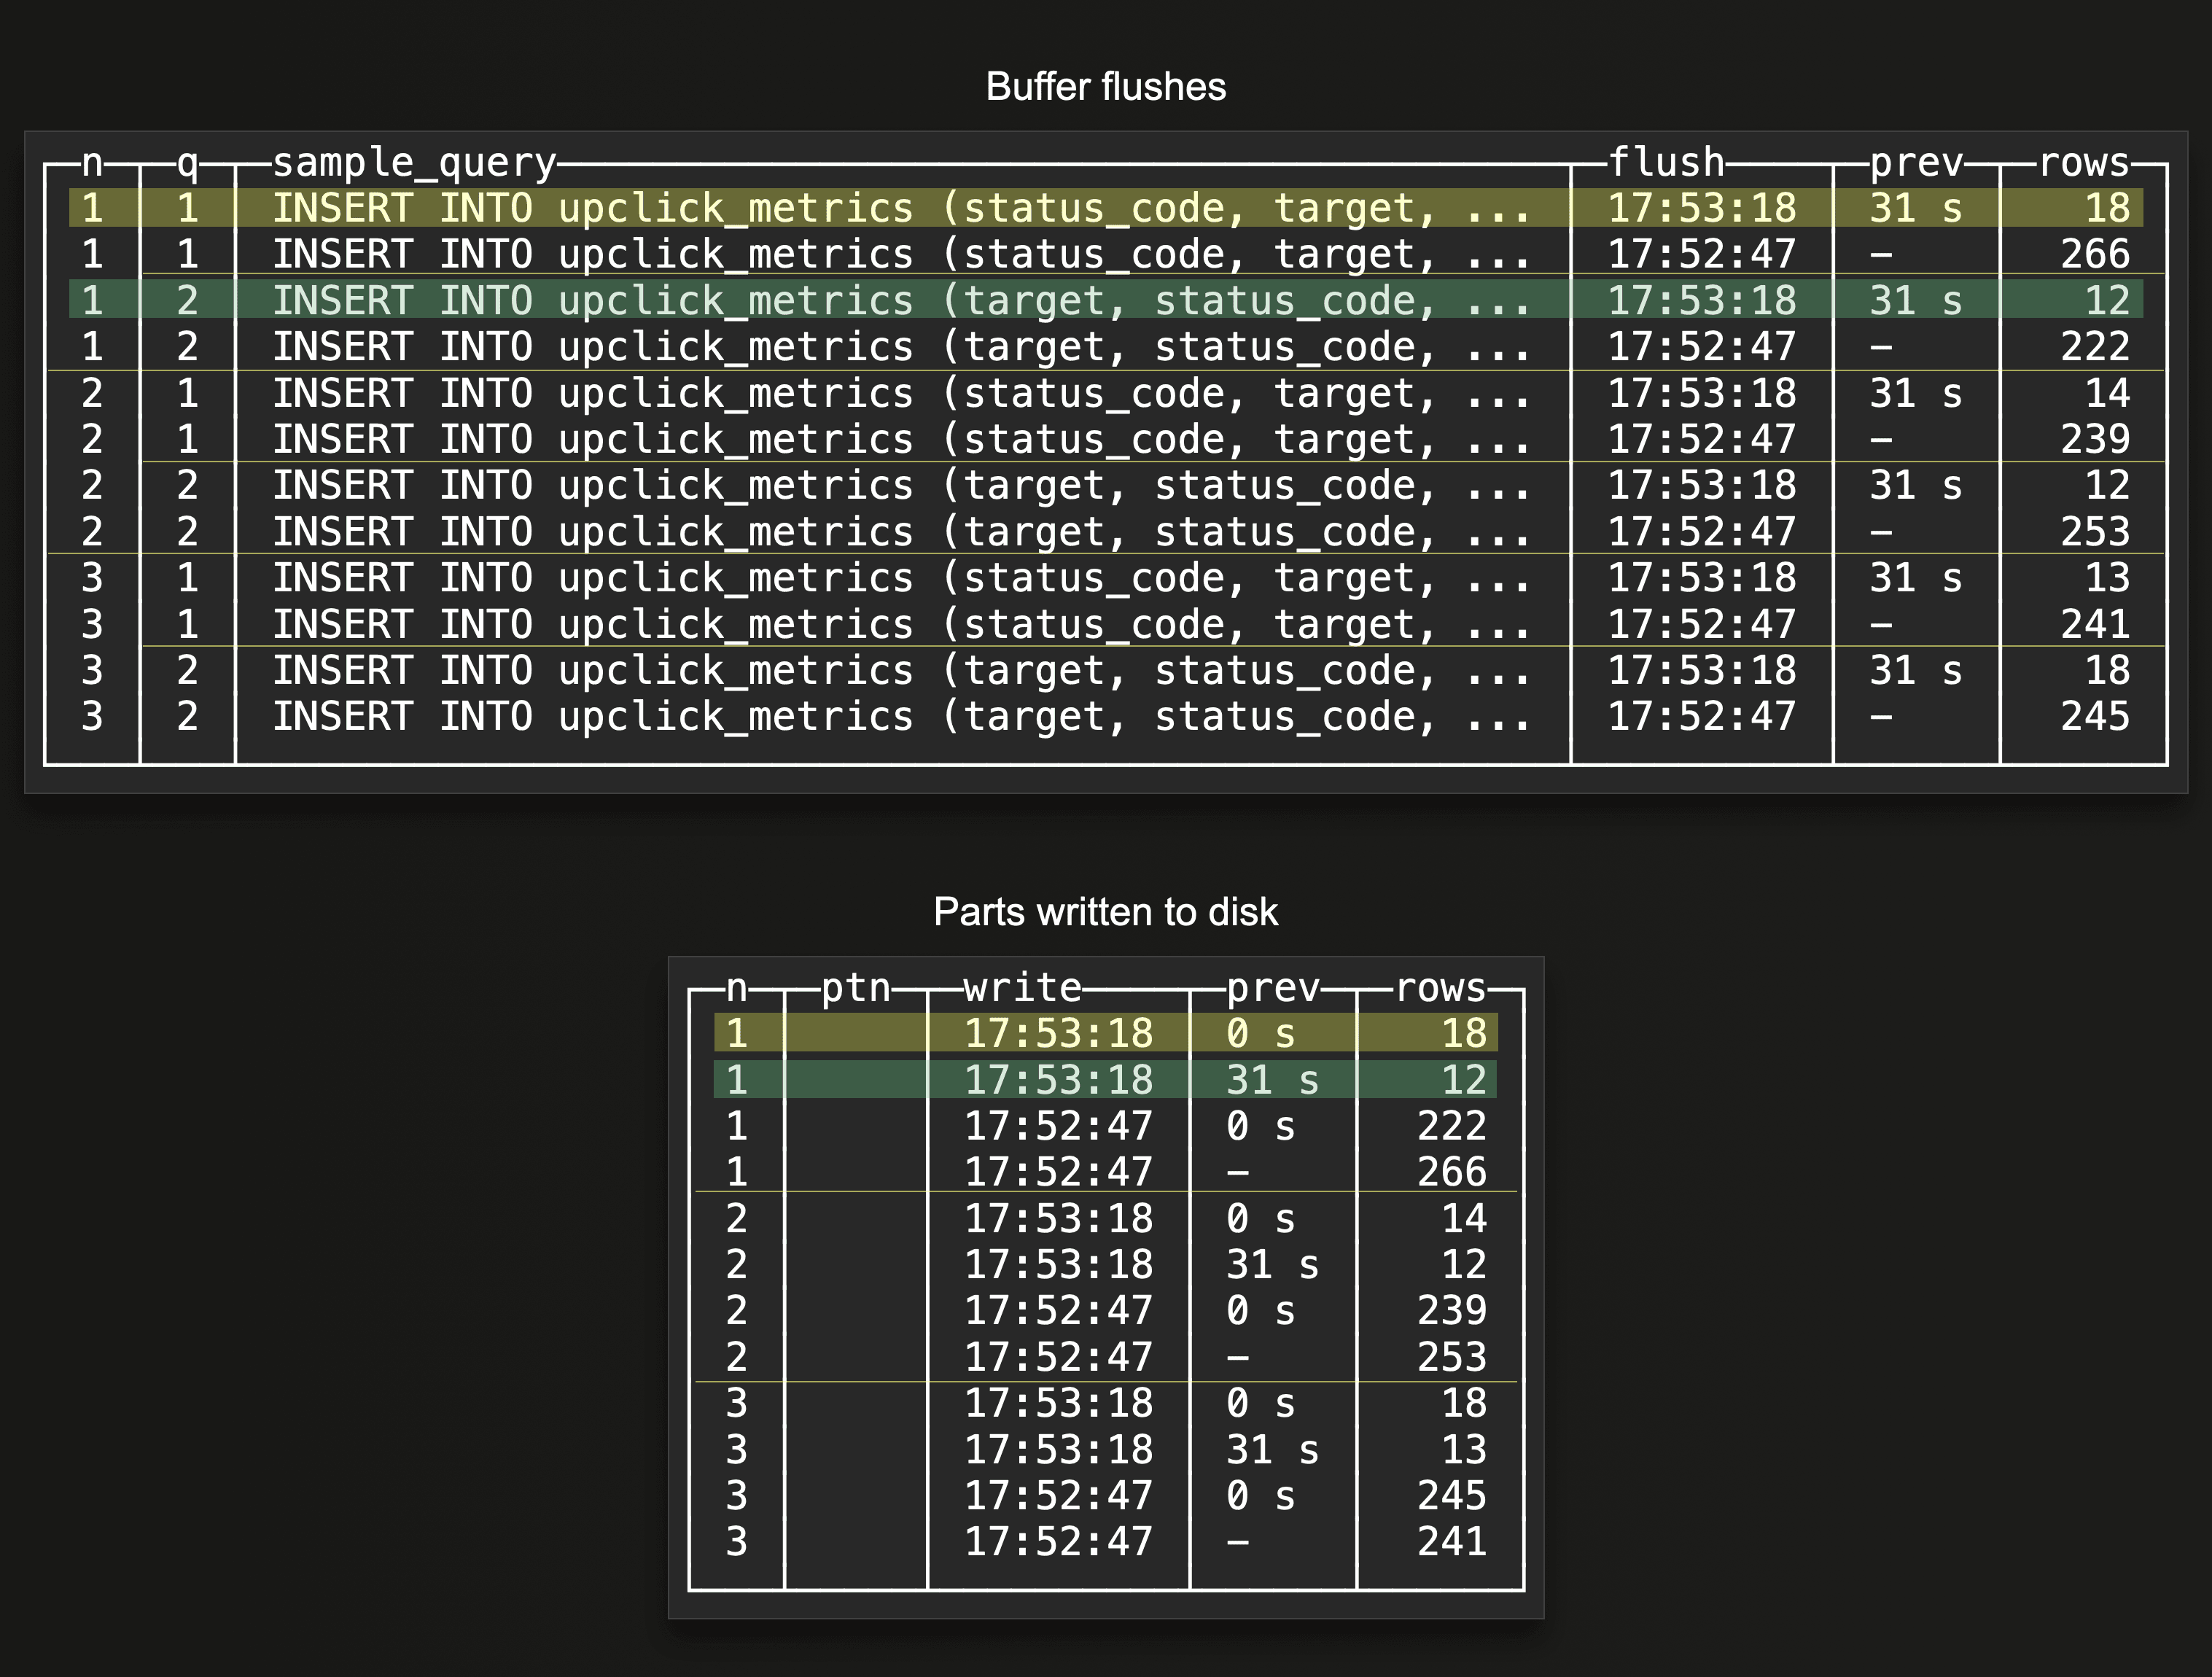 We configured asynchronous inserts with a 30-second buffer flush time. As indicated by the two highlighted rows in the
 Buffer flushes query result above, two buffer flushes took place on the same node on the next buffer flush timeout. Because the node received insert queries for the same target table but with two different syntactic shapes, there are two separate buffers on the node. As indicated by the two highlighted rows in the Parts written do disk query result, there is still a 1:1 relationship between buffer flushes and parts written to disk as there is no partitioning key is used in the target table.
Multiple settings
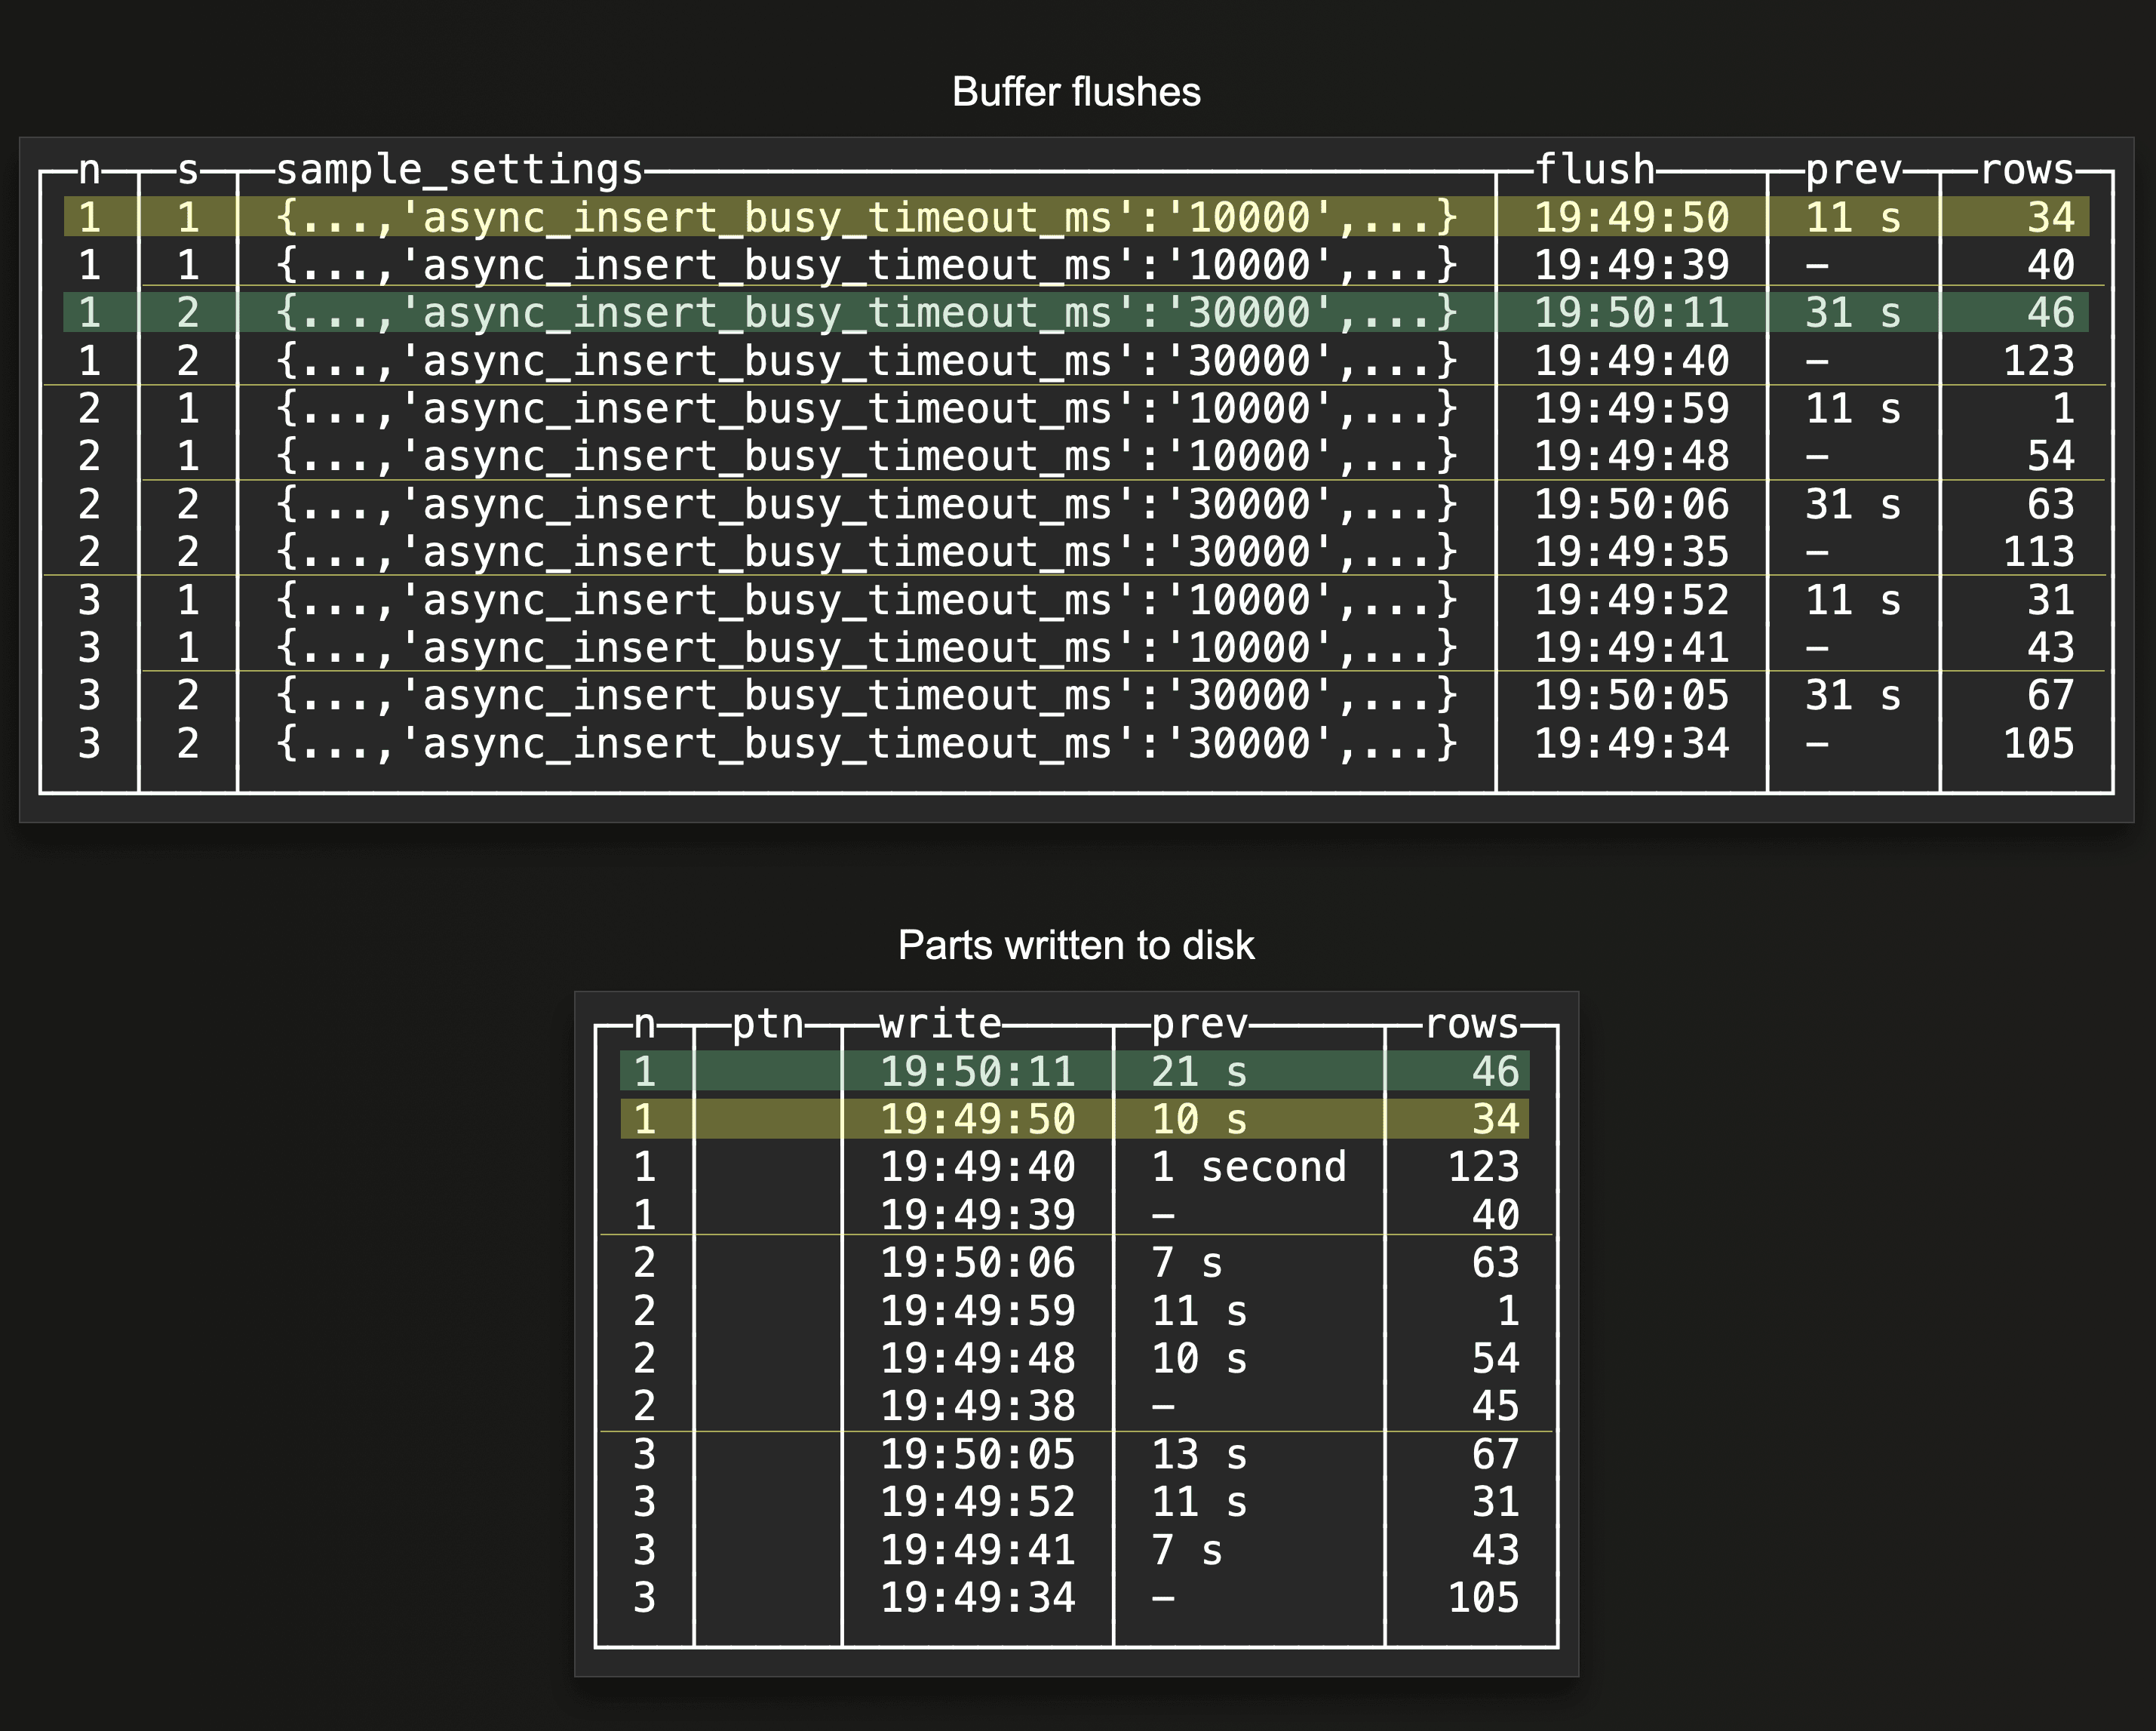
Similarly to different query shapes, there is a separate buffer per set of unique insert query settings. This can be useful for enabling different flush thresholds for data for the same table, and to control resource usage of specific data. We can observe these mixed buffer flush cycles below:
 The two highlighted rows in the
 Buffer flushes query result above show that there are two separate and different flush cycles on the same node for the same target table. Because the node received insert queries for the same target table but with two different settings, specifically buffer flush threshold settings, there are two buffers with separate flush cycles on the node. The two highlighted rows in the Parts written do disk query result show that there is still a 1:1 relationship between buffer flushes and parts written to disk, as there is no partitioning key is used in the target table.
Combinations
There can be scenarios with a combination of a partitioned target table and async inserts for this table with different query shapes and settings. This results in each cluster node operating a buffer per different query shape per setting set. This creates (at least) one part per different partitioning key value stored in the rows contained in the buffer when one of these buffers gets flushed. Our provided Buffer flushes and Parts written do disk introspection queries will indicate this properly.
Summary
In this blog post, we provided guidance and queries for introspecting asynchronous inserts. You can use the provided queries for double-checking and for troubleshooting your asynchronous insert configurations.