
Introduction
Google Analytics is ubiquitous and critical to most marketing functions for their statistical reporting. As someone who joined ClickHouse with no prior experience in marketing analytics and finding myself contributing content on a regular basis in the form of blogs, I had long assumed Google Analytics (GA4) provided a fast and seamless way to measure a website. So when tasked with reporting on the success of our content strategy, with the aim of ensuring that we were producing content relevant to you, our users, GA4 seemed like the obvious place to start.
With a naive enthusiasm, I formulated a set of questions that I assumed would be trivial for us to answer in GA4, such as “What does the distribution of views per blog look like from the day they are published?” The reaction of Adrian, our head of Marketing Operations, “politely” communicated this would take some time to formulate. Realizing we needed to report this on a monthly basis and seeing him busy with other more important tasks, I offered my own time to assist.
Reporting on blog performance quickly became the day of the month I most dreaded. While Google Analytics has its strengths, not least its ease of integration and use, it became apparent it was limited in a number of critical ways: data retention, sampling, performance, and flexibility. Rather than toil away in GA4 and dread the 2nd Monday of each month, we undertook a project to move all Google Analytics data to ClickHouse, with the aim of delivering flexible, fast analytics with infinite retention.
In this blog post, we explain our architecture, which hopefully fellow sufferers can use to build their own super-charged Google Analytics using only ClickHouse and a few lines of SQL. Most importantly, this can all be achieved for less than $20 a month using ClickHouse Cloud!
Challenges with GA4
Flexibility. Google Analytics' strength is its ease of integration to a site and its simple query interface. This simplicity comes at a cost, principally with flexibility. The interface, while easy to use, is restrictive and limits the user's ability to answer more complex questions such as "What is the distribution of views for blogs by the day of release?" Many of our questions also required external datasets, such as reading time and blog themes. While we were often able to overcome these challenges by either exporting data and using clickhouse local to query the files or using GA4's import data feature, the process was sluggish and time-consuming. As someone who considers themselves semi-technical, I longed for the flexibility of SQL.
Performance. Clickhouse.com is highly trafficked - in the 10s of thousands per day. While this might seem high, this volume of data is, in reality, very small for the sizes we're used to at ClickHouse. Despite this, the GA4 interface was always sluggish, with queries taking a long time to load. This made iterating on queries an extremely frustrating experience. And, as a company used to performing real-time analytics on data with lightning-fast response times, this performance was, at best frustrating and, at worst, led to us shy away from asking new questions about our data.
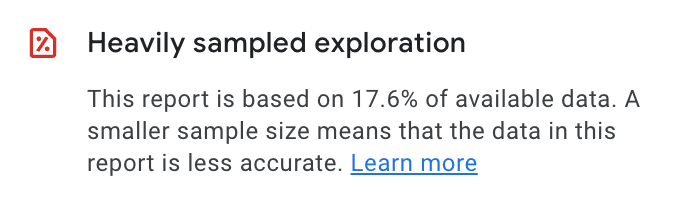
Sampling & ad-hoc queries. Given the comparatively low volumes of data, it was surprising that queries in Google Analytics often reported that the data was being sampled. For us, this manifested itself when issuing ad-hoc queries (reports seemed more reliable) that used a large number of dimensions or spanned a wide time period. GA4 provides means to work around this, including upgrading to Google Analytics 360 (for $150,000 per year!) or simply waiting a long time for results. Neither of these was acceptable to us, and the frustration of having unreliable results was particularly frustrating to us, as ClickHouse users who are used to fast, precise responses.
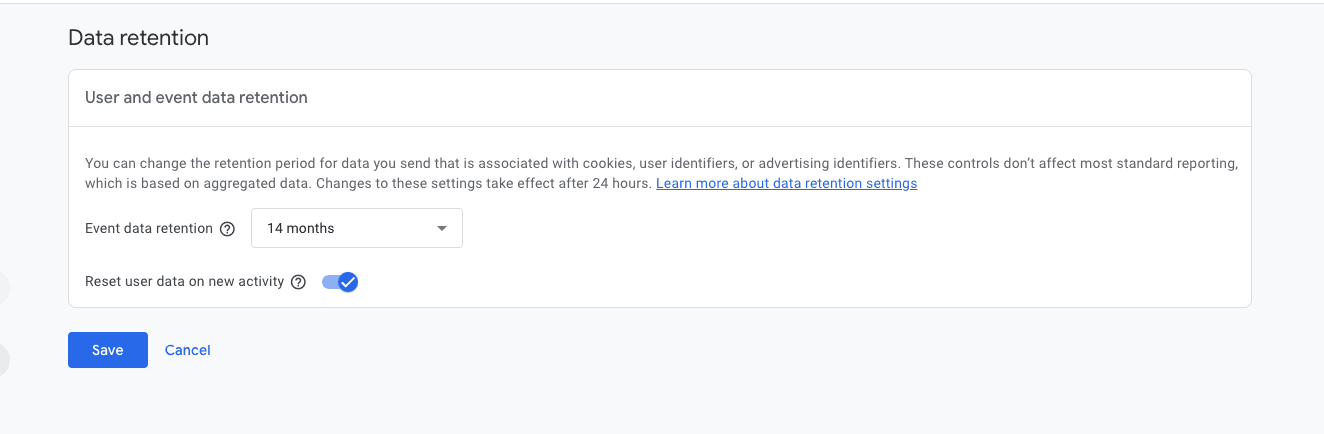
Data-retention. By default, GA4 retains data for two months. This can be increased to 14 months, with 360 (again, for $150,000 a year) required for longer periods. While we currently don’t have years of data, we wanted to be able to identify patterns over time, e.g. seasonal trends, using more than 2 data points.
Why ClickHouse for Google Analytics data
While ClickHouse was the obvious choice for us, as a dogfooding exercise, it is also the de facto database used for web analytics - the word “Click” comes from Click analytics, the original Google Analytics-like use case for which the database was developed.
As a real-time data warehouse supporting SQL, ClickHouse provides the required query flexibility we need. Almost all of our queries could be easily represented as SQL. ClickHouse dictionaries also provided the perfect solution to integrate our external data sources, such as blog themes and reading times.
Most of these queries comprise aggregations for which ClickHouse is optimized as a column-oriented database, capable of delivering sub-second response times on hundreds of billions of rows without sampling - well beyond the scale we saw from GA4.
ClickHouse supports a wide range of integrations that make the generation of reports simpler. As well as supporting the MySQL interface, allowing the use of tools such as Looker, Tableau, and QuickSight, native support for tools such as Superset and Grafana offered an open-source BI experience. Finally, we believed the raw data would be compressed well by ClickHouse and potentially kept indefinitely at a low cost - especially since ClickCloud Cloud uses object storage.
Internal data warehouse
At this point, it became obvious that we could solve more than simply blog reporting. Our marketing team was suffering from the same challenges identified above when reporting on wider site metrics.
As a company that prides itself on data-driven decision-making, we already have a dedicated team responsible for our internal data warehouse. If we could identify a simple way of making the data available and provide most of the required queries, we could utilize their existing techniques for loading, managing, and visualizing data.
While ClickHouse would be an ideal data store for web analytics data, we still wanted to retain the data collection capabilities of GA4 and Google Tag Manager. We had little interest in writing our own Javascript library responsible for session tracking and data collection. Ideally, we could simply ensure the data was exported to ClickHouse at a reasonable frequency.
Getting Data out of GA4
Believing it was unlikely that the pains we were experiencing above were unique, we explored ways to export data from Google Analytics. Google offers a number of ways to achieve this, most of which come with some limitations. The best solution appeared to be exporting the data to BigQuery. This had a number of advantages over other solutions, such as the Data API, including:
- This would export the raw data with no sampling.
- Google allows up to 1m events per day to be exported as a batch to a daily table. This was sufficient for our needs and below our current thresholds. We may need to ask Google to increase this in the future.
- Data can be exported in a streaming mode to an intraday table as well as a daily export. The intraday “live” table typically lags real-time by a few minutes. Most importantly, this export has no limits! It does, however, not contain all of the same events (although it conforms to the same schema) - preventing some queries from being run on real-time data. This interestingly opened the possibility of real-time dashboards!
Streaming exports incur around $0.05 per gigabyte of data. 1 gigabyte equates to approximately 600,000 Google Analytics events. This should be insignificant for more users.
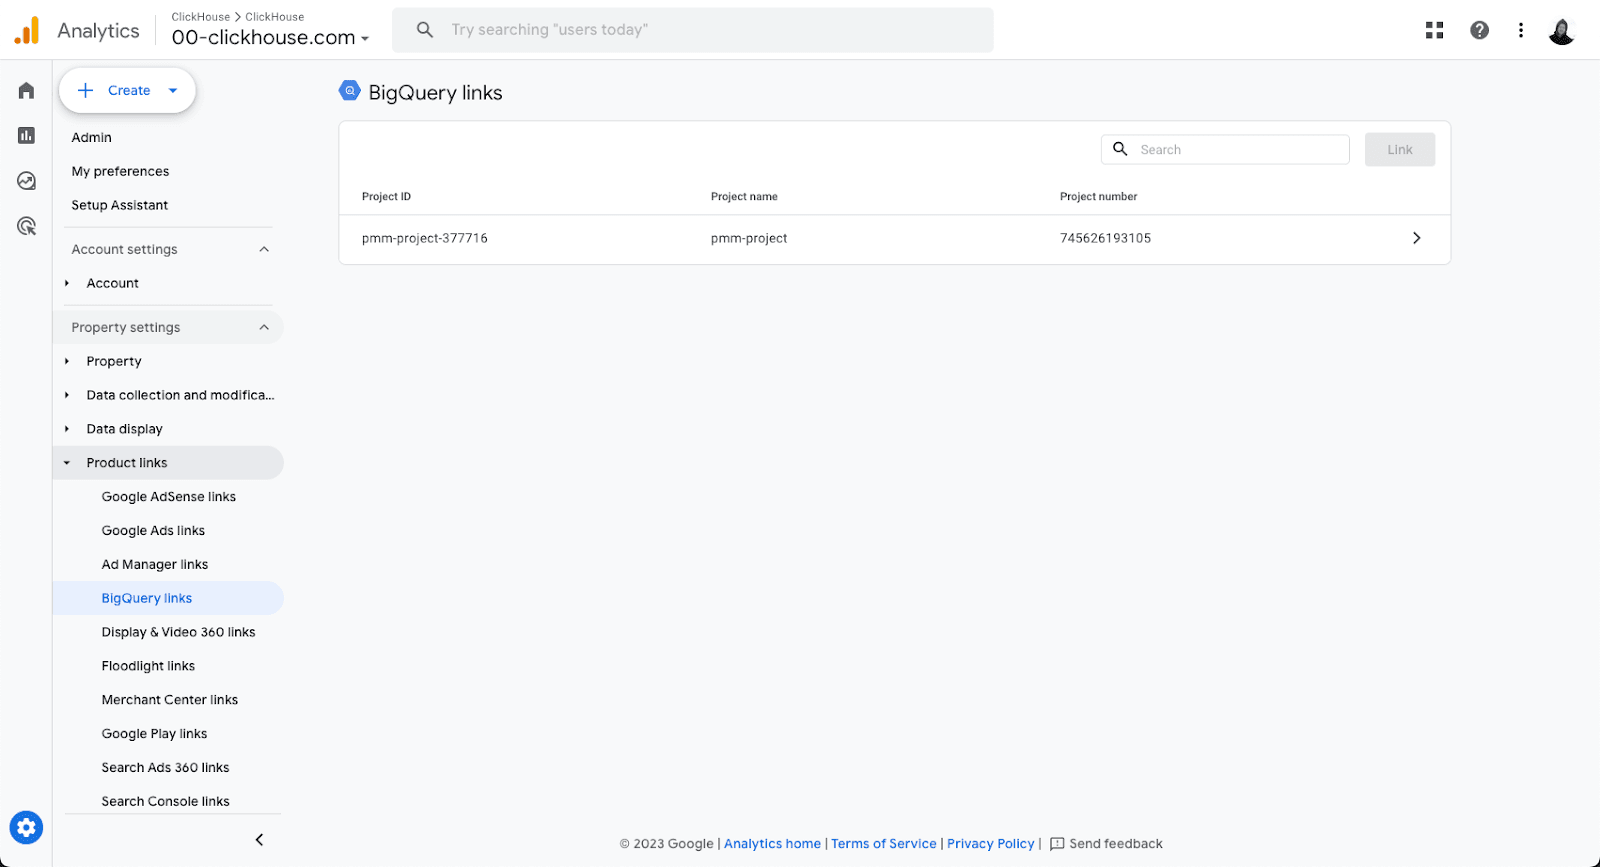
Configuration of this connection is simple and well documented, provided you have BigQuery enabled for your Google Cloud account.
Maybe the obvious question then becomes, “Why not just use BigQuery for your analytics?”
Cost and performance. We wanted to run queries regularly with real-time dashboards, especially with access to live data. While BigQuery is great for ad-hoc analytics on complex queries, it charges for data scanned, making costs unpredictable. Conversely, ClickHouse Cloud serves these queries at a fixed cost with a small cluster (e.g. Development Tier service at < $200 per month). Furthermore, BigQuery typically incurs a minimum latency on queries. We knew that ClickHouse would deliver millisecond response times and is better suited to the flat schema (only two tables) and aggregation-heavy queries. Further details on the differences between BigQuery and ClickHouse can be found here.
BigQuery to ClickHouse
Details on how data can be migrated between BigQuery and ClickHouse can be found in our documentation here. In summary, we rely on two scheduled queries to export data to a GCS bucket in Parquet: one for the daily table (format events_YYYYMMDD) and one for the live intraday table (format events_intraday_YYYYMMDD). Parquet is our preferred export format due to its good compression, structured schema, and excellent support in ClickHouse for fast reading. Users can then use either scheduled INSERT INTO SELECT queries, using cron services and the gcs table function, or the recently released S3Queue to import this data into ClickHouse.
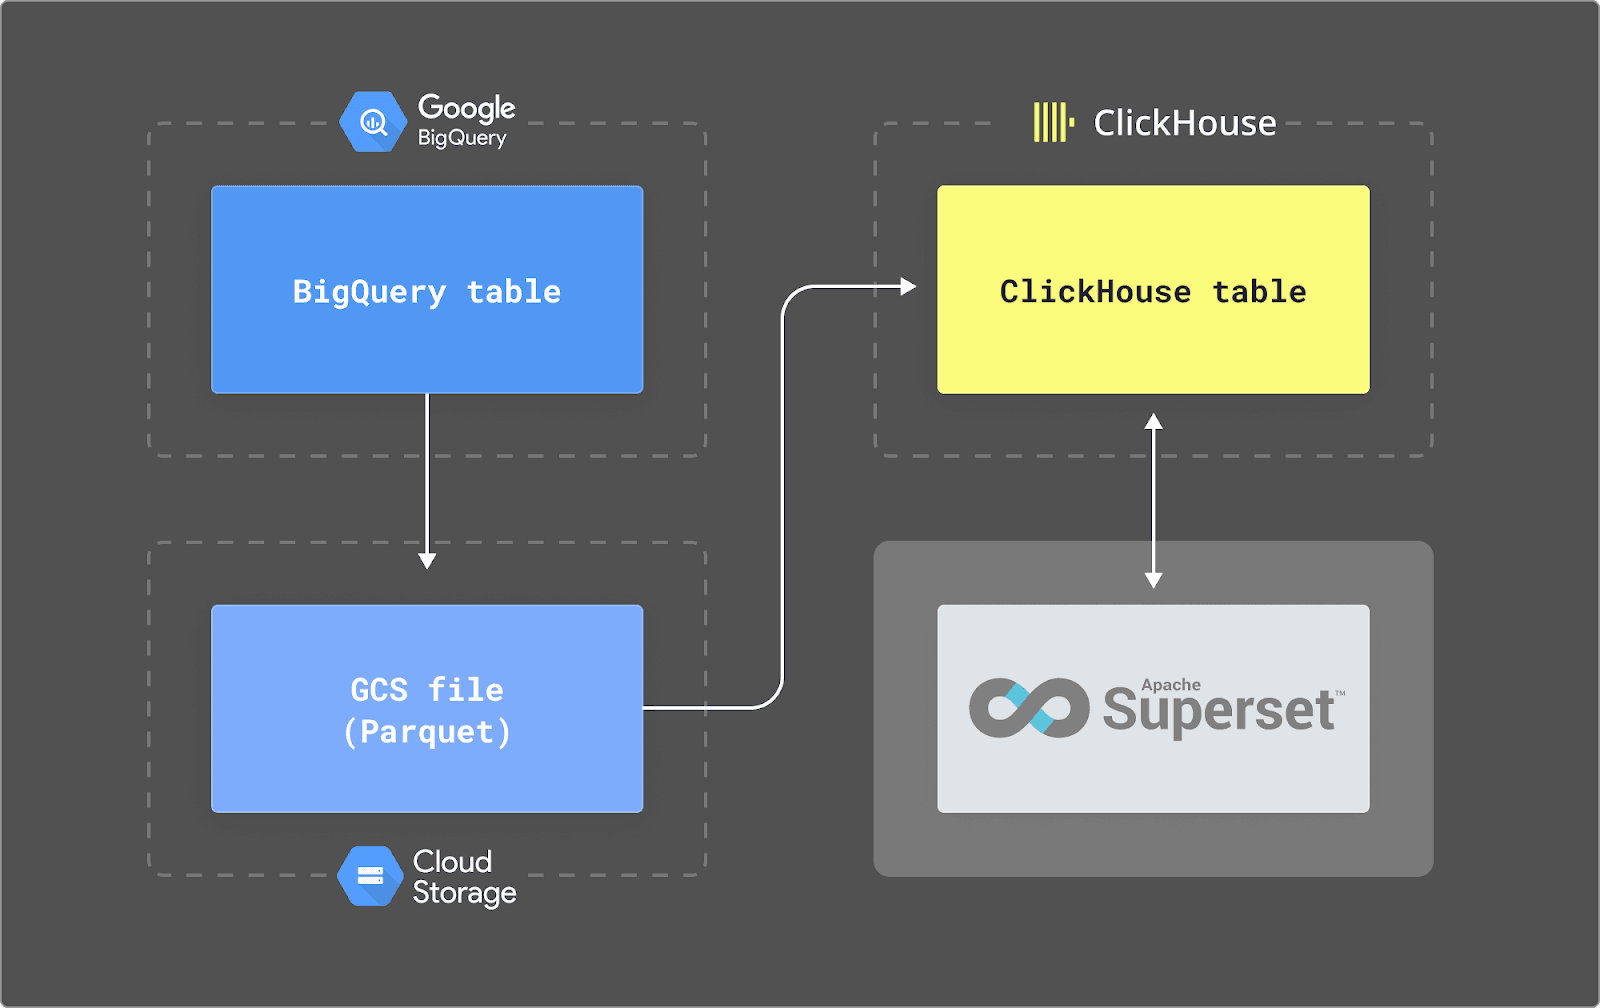
We provide more detail on this architecture below.
BigQuery export
To export data from BigQuery, we rely on scheduled queries and their ability to export to GCS.
We found that the daily table would be created for the previous day at around 4 pm GMT. This means the data for a day isn’t available for at least 16 hours. The entire day is made available at once, so the earliest events for the day lag by up to 40 hours! This makes the intraday data even more important. To be safe, we export at 6 pm using the following scheduled query in BigQuery. Exports in BigQuery are free up to 50TiB per day, with a small cost for storage.
DECLARE export_path string;
DECLARE export_day DATE;
SET export_day = DATE_SUB(@run_date, INTERVAL 1 DAY);
SET export_path = CONCAT('gs://clickhouse-website/daily/', FORMAT_DATE('%Y%m%d', export_day),'-*.parquet');

EXECUTE IMMEDIATE format('EXPORT DATA OPTIONS ( uri = \'%s\', format = \'PARQUET\', overwrite = true) AS (SELECT * FROM `<cloud_project>.<dataset>.events_%s` ORDER BY event_timestamp ASC)', export_path,  FORMAT_DATE('%Y%m%d', export_day));
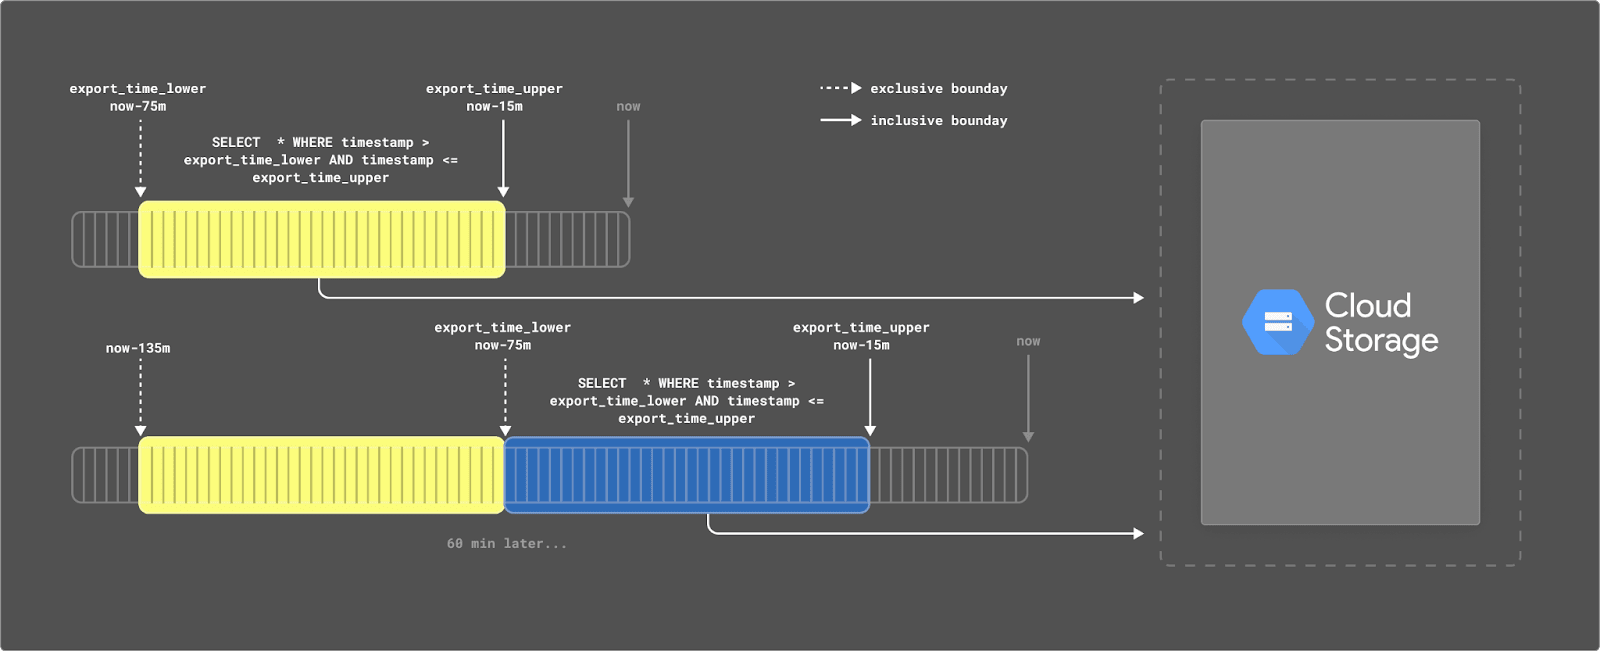
Export of the live data from the intra-day table can be performed more regularly. Currently, we schedule our export every hour. Every hour, we export the last 60 minutes of data. However, we offset this window to allow for a possible delay in events and appearing in BigQuery. While typically, this doesn’t exceed more than 4 minutes, we utilize 15 minutes to be safe. Every time we run an export, we are therefore exporting all rows from now-75mins to now-15mins. This is visualized below:
This scheduled query is shown below.
DECLARE
export_time_lower TIMESTAMP DEFAULT TIMESTAMP_SUB(@run_time, INTERVAL 75 MINUTE);
DECLARE
export_time_upper TIMESTAMP DEFAULT TIMESTAMP_SUB(@run_time, INTERVAL 15 MINUTE);

CREATE TEMP TABLE ga_temp AS
SELECT *
FROM `<cloud_project>.<dataset>.events_intraday_*` WHERE TIMESTAMP_MICROS(event_timestamp) > export_time_lower
  AND TIMESTAMP_MICROS(event_timestamp) <= export_time_upper;

EXPORT DATA
OPTIONS ( uri = CONCAT('gs://clickhouse-website/ga-', FORMAT_TIMESTAMP("%Y%m%d%H%M%S",TIMESTAMP_TRUNC(TIMESTAMP_SUB(CURRENT_TIMESTAMP(),INTERVAL 1 HOUR), HOUR), "UTC"), '_*.parquet'),
  format = 'PARQUET', overwrite = true) AS (


SELECT * FROM ga_temp ORDER BY event_timestamp ASC);
Schema
The schemas for both the daily and intraday tables are identical and documented here. The schema of the Parquet files generated by the above export process can be found here for reference. We map this schema to the following ClickHouse schema:
CREATE OR REPLACE TABLE default.ga_daily
(
	`event_date` Date,
	`event_timestamp` DateTime64(3),
	`event_name` String,
	`event_params` Map(String, String),
	`ga_session_number` MATERIALIZED CAST(event_params['ga_session_number'], 'Int64'),
	`ga_session_id` MATERIALIZED CAST(event_params['ga_session_id'], 'String'),
	`page_location` MATERIALIZED CAST(event_params['page_location'], 'String'),
	`page_title` MATERIALIZED CAST(event_params['page_title'], 'String'),
	`page_referrer`  MATERIALIZED CAST(event_params['page_referrer'], 'String'),
	`event_previous_timestamp` DateTime64(3),
	`event_bundle_sequence_id` Nullable(Int64),
	`event_server_timestamp_offset` Nullable(Int64),
	`user_id` Nullable(String),
	`user_pseudo_id` Nullable(String),
	`privacy_info` Tuple(analytics_storage Nullable(String), ads_storage Nullable(String), uses_transient_token Nullable(String)),
	`user_first_touch_timestamp` DateTime64(3),
	`device` Tuple(category Nullable(String), mobile_brand_name Nullable(String), mobile_model_name Nullable(String), mobile_marketing_name Nullable(String), mobile_os_hardware_model Nullable(String), operating_system Nullable(String), operating_system_version Nullable(String), vendor_id Nullable(String), advertising_id Nullable(String), language Nullable(String), is_limited_ad_tracking Nullable(String), time_zone_offset_seconds Nullable(Int64), browser Nullable(String), browser_version Nullable(String), web_info Tuple(browser Nullable(String), browser_version Nullable(String), hostname Nullable(String))),
	`geo` Tuple(city Nullable(String), country Nullable(String), continent Nullable(String), region Nullable(String), sub_continent Nullable(String), metro Nullable(String)),
	`app_info` Tuple(id Nullable(String), version Nullable(String), install_store Nullable(String), firebase_app_id Nullable(String), install_source Nullable(String)),
	`traffic_source` Tuple(name Nullable(String), medium Nullable(String), source Nullable(String)),
	`stream_id` Nullable(String),
	`platform` Nullable(String),
	`event_dimensions` Tuple(hostname Nullable(String)),
	`collected_traffic_source` Tuple(manual_campaign_id Nullable(String), manual_campaign_name Nullable(String), manual_source Nullable(String), manual_medium Nullable(String), manual_term Nullable(String), manual_content Nullable(String), gclid Nullable(String), dclid Nullable(String), srsltid Nullable(String)),
	`is_active_user` Nullable(Bool)
)
ENGINE = MergeTree
ORDER BY (event_timestamp, event_name, ga_session_id)
This schema represents our initial iteration, and users may wish to adapt. Typically, users may wish to present this data in views to their business users for easier consumption or materialize specific columns for syntactically easier (and faster) access e.g. in the above, we have materialized the columns ga_session_id, page_location, page_title and page_referer.
Our ordering key has been selected for our access patterns and the queries below.
Experienced ClickHouse users will notice the use of Nullable, typically an inefficient means of representing empty values in ClickHouse. We currently keep these as we need them when converting the event_params to a more accessible Map(String,String). In the future, we plan to add schema hints for Parquet files to allow us to turn off making Parquet columns nullable by default i.e.
schema_inference_make_columns_nullable = 0. We expect this Nullable overhead to be minimal, however, due to the data volumes being low for ClickHouse.
We can insert data from Parquet files into this schema, using the gcs function and the following INSERT INTO SELECT. This statement is the same for both tables.
INSERT INTO ga_daily SELECT
  event_date::Date as event_date,
  fromUnixTimestamp64Micro(event_timestamp) as event_timestamp,
  ifNull(event_name, '') as event_name,
  mapFromArrays(
	arrayMap(x -> x.1::String, event_params),
	arrayMap(x -> arrayFilter(val -> isNotNull(val),array(untuple(x.2:: Tuple(string_value Nullable(String), int_value Nullable(String), float_value Nullable(String), double_value Nullable(String))))::Array(Nullable(String)))[1], event_params)
  )::Map(String, String) as event_params,
  fromUnixTimestamp64Micro(ifNull(event_previous_timestamp,0)) as event_previous_timestamp,
  event_bundle_sequence_id,
  event_server_timestamp_offset,
  user_id,
  user_pseudo_id,
  privacy_info,
  fromUnixTimestamp64Micro(ifNull(user_first_touch_timestamp,0)) as user_first_touch_timestamp,
  device,
  geo,
  app_info,
  traffic_source,
  stream_id,
  platform,
  event_dimensions,
  collected_traffic_source,
  is_active_user
FROM  gcs('https://storage.googleapis.com/clickhouse-website/ga-*.parquet','<key>','<secret>')
Most of the columns here are a straight mapping. We do, however, convert the event_params column to a Map(String,String) from the format to Array(Tuple(key Nullable(String), value Tuple(string_value Nullable(String), int_value Nullable(Int64), float_value Nullable(Float64), double_value Nullable(Float64)))) to make querying simpler syntactically.
GCS to ClickHouse
While our internal data warehouse has its own custom mechanisms for loading data, ClickHouse users can reproduce the above architecture with either a scheduled INSERT INTO SELECT e.g. using simple cron or via Cloud Scheduler, or using the recently released S3Queue table engine. We demonstrate this below:
CREATE TABLE ga_queue
ENGINE = S3Queue('https://storage.googleapis.com/clickhouse-website/daily/*.parquet', '<key>', '<secret>', 'Parquet')
SETTINGS mode = 'unordered', s3queue_enable_logging_to_s3queue_log=1, s3queue_tracked_files_limit=10000

CREATE MATERIALIZED VIEW ga_mv TO ga_daily AS
SELECT
  event_date::Date as event_date,
  fromUnixTimestamp64Micro(event_timestamp) as event_timestamp,
  ifNull(event_name, '') as event_name,
  mapFromArrays(
	arrayMap(x -> x.1::String, event_params),
	arrayMap(x -> arrayFilter(val -> isNotNull(val),array(untuple(x.2:: Tuple(string_value Nullable(String), int_value Nullable(String), float_value Nullable(String), double_value Nullable(String))))::Array(Nullable(String)))[1], event_params)
  )::Map(String, String) as event_params,
  fromUnixTimestamp64Micro(ifNull(event_previous_timestamp,0)) as event_previous_timestamp,
  event_bundle_sequence_id,
  event_server_timestamp_offset,
  user_id,
  user_pseudo_id,
  privacy_info,
  fromUnixTimestamp64Micro(ifNull(user_first_touch_timestamp,0)) as user_first_touch_timestamp,
  device,
  geo,
  app_info,
  traffic_source,
  stream_id,
  platform,
  event_dimensions,
  collected_traffic_source,
  is_active_user
FROM ga_queue
Further examples of this capability can be found here.
In the future, we also plan to add support for incrementally loading data from object storage using ClickPipes: ClickHouse Cloud’s native data ingestion service engine that makes loading data as simple as clicking a few buttons.
Queries
One of the principal concerns of moving all data to Clickhouse was the ability to replicate the metrics delivered by Google Analytics from the raw data Google provides in the export. While Google documents some queries, they do not provide the equivalent queries for the standard reporting concepts of new users, active users, total users, returning users, or total sessions. In order for marketing to utilize the ClickHouse solution, we need queries that would deliver numbers comparable to those historically reported.
The following queries show those that we currently use and their margin of error relative to the number reported by GA4. This difference has been computed over a one-month period. Note that all queries are not possible on live intraday data, as some required columns are not provided. We indicate this below.
| Metric | ClickHouse query | Difference with GA4 | Supported for intraday |
|---|---|---|---|
| Total users | SELECT event_date, uniqExact(user_pseudo_id) AS total_users FROM ga_daily WHERE event_name = 'session_start' GROUP BY event_date ORDER BY event_date ASC | -0.71% | Yes |
| Active users | SELECT event_date, uniqExact(user_pseudo_id) AS active_usersFROM ga_dailyWHERE ((event_name = 'session_start') AND is_active_user) OR (event_name = 'first_visit')GROUP BY event_dateORDER BY event_date ASC | -0.84 | No. is_active_user is not populated |
| New users | SELECT event_date, count() AS new_usersFROM ga_dailyWHERE event_name = 'first_visit'GROUP BY event_dateORDER BY event_date ASC | 0% | Yes |
| Returning users | SELECT event_date, uniqExact(user_pseudo_id) AS returning_usersFROM ga_dailyWHERE (event_name = 'session_start') AND is_active_user AND (ga_session_number > 1 OR user_first_touch_timestamp < event_date)GROUP BY event_dateORDER BY event_date ASC | +1.03% | No. is_active_user is not populated |
| Total sessions | SELECT event_date, uniqExact(ga_session_id, '_', user_pseudo_id) AS session_idFROM ga_dailyGROUP BY event_dateORDER BY event_date ASC | -0.56% | Yes |
While we continue to try and narrow the above differences, the above differences were considered acceptable for reporting moving forward. We welcome improvements to the above queries.
Validating the approach
Our data is loaded into our internal data warehouse, which hosts many datasets with significant resources, making it difficult to provide a precise assessment of the cost of running our ClickHouse-enhanced GA solution. Our initial testing, however, was performed in a ClickHouse Cloud Development tier service. This limits storage to 1TiB and provides a total of 4vCPUs and 16GiB RAM across two nodes, more than sufficient for running the above solution for most organizations.
Below, we present the possible costs of running our solution based on this service and assess the volume of GA4 data that could potentially be stored. We also show query performance is still very fast. Our sample data covers a 42-day period.
Compression
SELECT
	table,
	formatReadableQuantity(sum(rows)) AS total_rows,
	round(sum(rows) / 42) AS events_per_day,
	formatReadableSize(sum(data_compressed_bytes)) AS compressed_size,
	formatReadableSize(sum(data_uncompressed_bytes)) AS uncompressed_size,
	round(sum(data_uncompressed_bytes) / sum(data_compressed_bytes), 2) AS ratio
FROM system.parts
WHERE (table LIKE 'ga_daily') AND active
GROUP BY table
ORDER BY sum(rows) ASC

┌─table────┬─total_rows───┬─events_per_day─┬─compressed_size─┬─uncompressed_size─┬─ratio─┐
│ ga_daily │ 5.75 million │     	136832 │ 525.34 MiB  	│ 4.56 GiB      	│  8.88 │
└──────────┴──────────────┴────────────────┴─────────────────┴───────────────────┴───────┘

1 row in set. Elapsed: 0.008 sec.
The above shows that 42 days' worth of data is around 4.6GiB in size uncompressed, with around 135k events per day. The space on the disk, however, is compressed to only 525MiB. We assume our intra-day table consumes a similar amount of space. This would thus potentially allow a Development Tier service to store = 420429 ((1048576/(525*2)) * 421) days or 1100 years of GA4 data to be stored. This is probably more than sufficient for our use case!*
Users should be able to extrapolate the above based on events per day. Even a site 100x larger than clickhouse.com should be able to host 10 yrs of data in a single Development Tier instance.
*This is prior to further schema optimizations e.g. removal of Nullables.
Query performance
The BigQuery export service for GA4 does not support the historical export of data. This prevents us from performing an extensive query test at this stage (we’ll share later based on real-world usage), restricting the queries below to 42 days (the time since we started moving data from BigQuery into ClickHouse). This is sufficient for our use case as the majority of our queries cover a one-month period, with queries analyzing historical trends rarer. The below queries query for total, returning, and new users for the month of October for the blog area of our website, grouping results by day.
Total users
SELECT
	event_date,
	uniqExact(user_pseudo_id) AS total_users
FROM ga_daily
WHERE (event_name = 'session_start') AND ((event_timestamp >= '2023-10-01') AND (event_timestamp <= '2023-10-31')) AND (page_location LIKE '%/blog/%')
GROUP BY event_date
ORDER BY event_date ASC

31 rows in set. Elapsed: 0.354 sec. Processed 4.05 million rows, 535.37 MB (11.43 million rows/s., 1.51 GB/s.)
Peak memory usage: 110.98 MiB.
Returning users
SELECT event_date, uniqExact(user_pseudo_id) AS returning_users
FROM ga_daily
WHERE (event_name = 'session_start') AND is_active_user AND (ga_session_number > 1 OR user_first_touch_timestamp < event_date) AND ((event_timestamp >= '2023-10-01') AND (event_timestamp <= '2023-10-31')) AND (page_location LIKE '%/blog/%')
GROUP BY event_date
ORDER BY event_date ASC

31 rows in set. Elapsed: 0.536 sec. Processed 4.05 million rows, 608.24 MB (7.55 million rows/s., 1.13 GB/s.)
Peak memory usage: 155.48 MiB.
New Users
SELECT event_date, count() AS new_users
FROM ga_daily
WHERE event_name = 'first_visit' AND ((event_timestamp >= '2023-10-01') AND (event_timestamp <= '2023-10-31')) AND (page_location LIKE '%/blog/%')
GROUP BY event_date
ORDER BY event_date ASC

31 rows in set. Elapsed: 0.320 sec. Processed 4.05 million rows, 411.97 MB (12.66 million rows/s., 1.29 GB/s.)
Peak memory usage: 100.78 MiB.
The above shows how all queries return in under 0.5s. The ordering key for our table could be further optimized, and users are free to utilize features such as Materialized Views and Projections if further performance improvements are required.
Cost
In the below pricing, we assume the use of around 100GiB of storage, or 10% of capacity. This is effectively around 110 years of data for clickhouse.com, 10 years of data for a site 10x the size, or a 1-year retention for a site 100x the size. In reality, as shown, storage is an insignificant % of the total cost due to the use of object storage in ClickHouse Cloud, and the larger site could easily store for multiple years and still remain under $20.
We assume the cluster is active for 2 hours a day in total. This should be sufficient for loading the intra-day data every hour and the daily export, along with additional ad-hoc queries performed by a curious marketing department. As shown below, the larger daily export can be inserted in under 5 seconds.
Note that if the full 1TiB of storage is used, this costs a maximum of $193 per month. In reality, if the cluster is not being used, it will idle (only storage charges are incurred), thus reducing costs.
INSERT INTO ga_daily SELECT
	...
FROM gcs('https://storage.googleapis.com/clickhouse-website/daily/20231009-000000000000.parquet', '<key>', '<secret>')

0 rows in set. Elapsed: 5.747 sec. Processed 174.94 thousand rows, 15.32 MB (30.44 thousand rows/s., 2.67 MB/s.)
Compute cost per hour: $0.2160 Storage cost per month: $35.33 * 0.1 = $3.53 Active hrs per day: 2
Total cost: (2 hours per day * 0.2160 * 30 days) + 3.53 = $16.50
That’s $16 a day for enhanced Google Analytics in ClickHouse!
There are some additional costs here which we believe should be negligible. These include:
- Export costs from GA4 to BigQuery. $0.05 per gigabyte of data. 1 gigabyte equates to approximately 600,000 Google Analytics events or 5x the above sample data. We assume this to be thus negligible i.e. < $1 for a site 10x the size.
- Storage of data in BigQuery. The first 1 TiB per month is free; thereafter on-demand pricing is around $6 per TiB. Given the above volumes, users should not incur charges here and can expire data in BigQuery after N days if concerned.
Visualizing
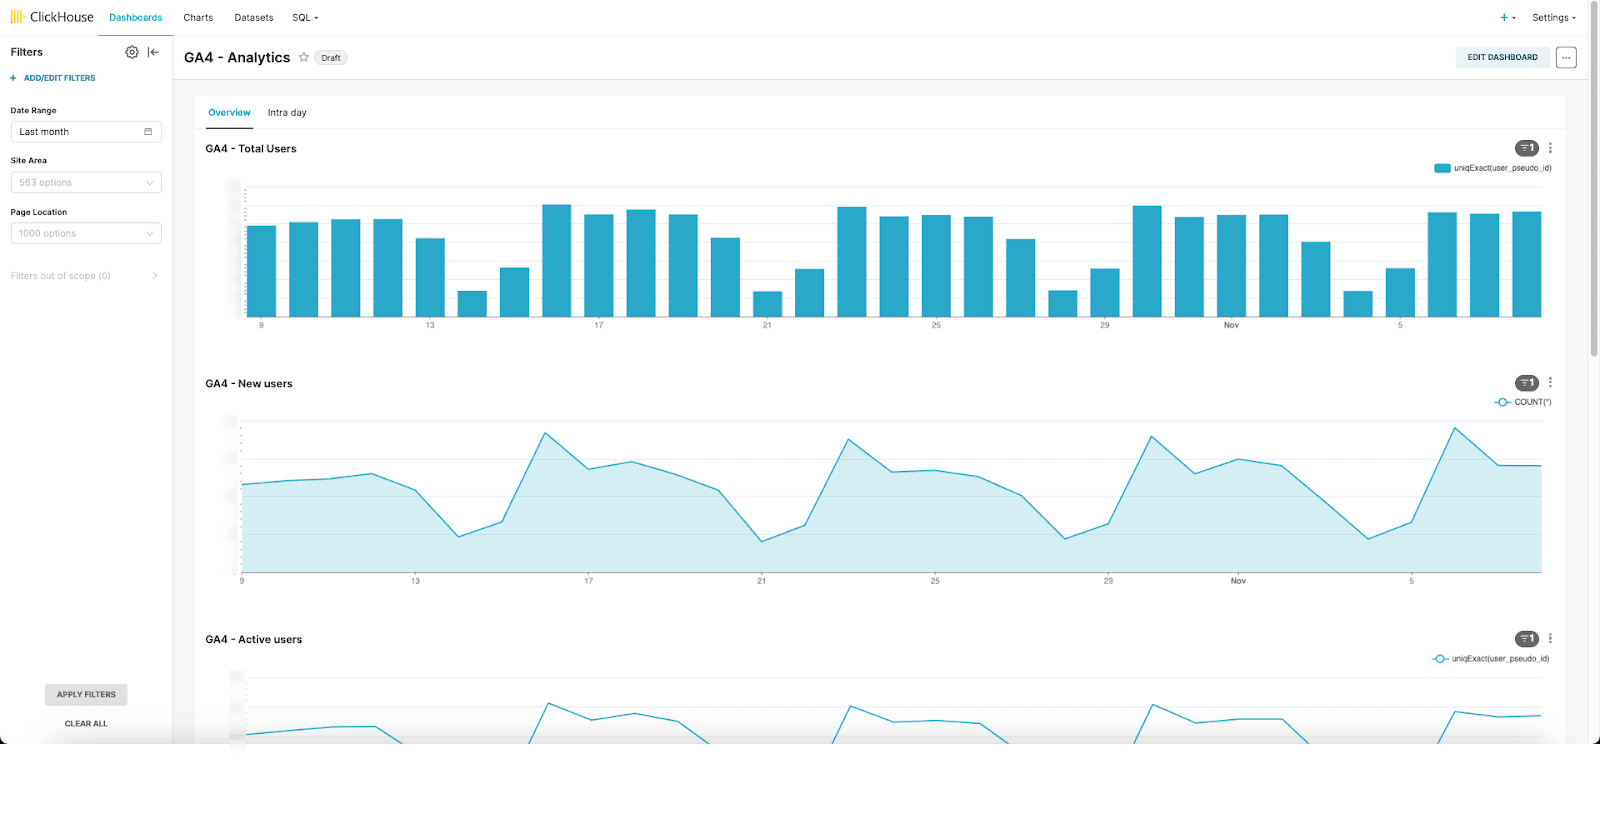
ClickHouse supports a wide range of visualization tools from Tableau to QuickSight. For our internal data warehouse, we utilize Superset and the official ClickHouse connector. With a huge range of visualization options, we have found this to be an excellent solution that is more than sufficient for our needs. We do recommend exposing the tables as physical datasets such that queries can be composed by Superset and filters applied over dashboards on all columns in the schema. Below, we show a few examples of visualizations.
Overview dashboard
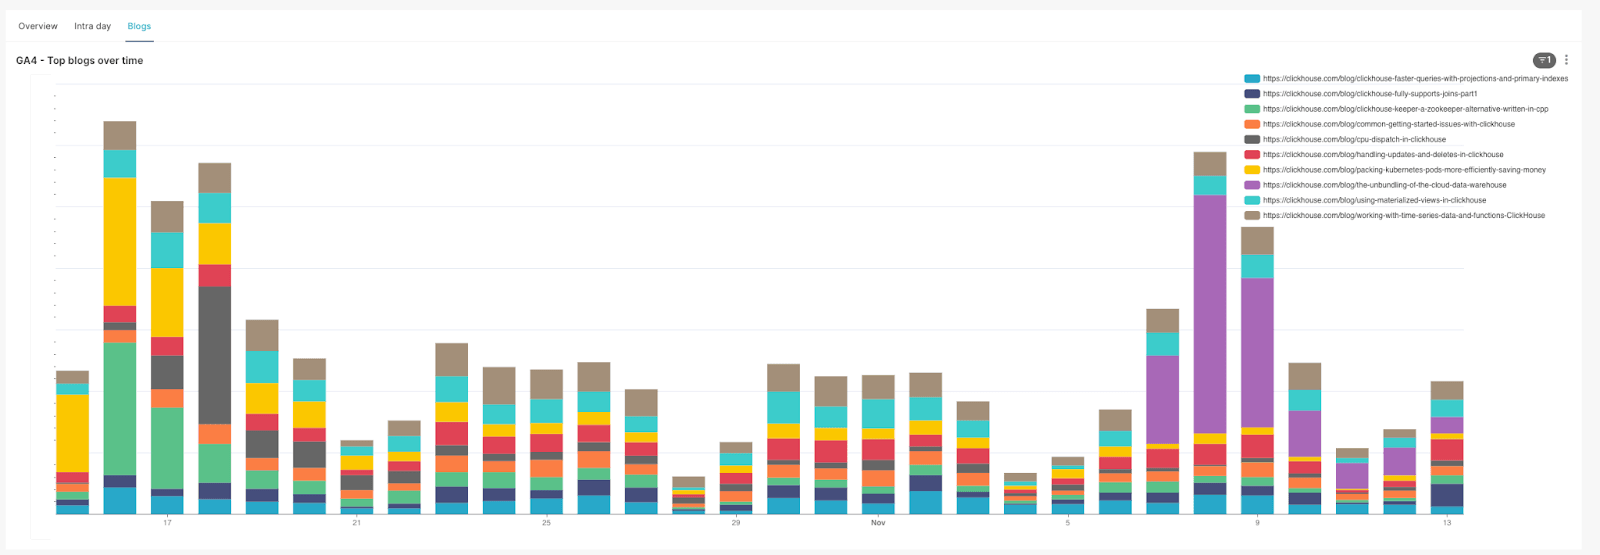
Most popular blog posts over time
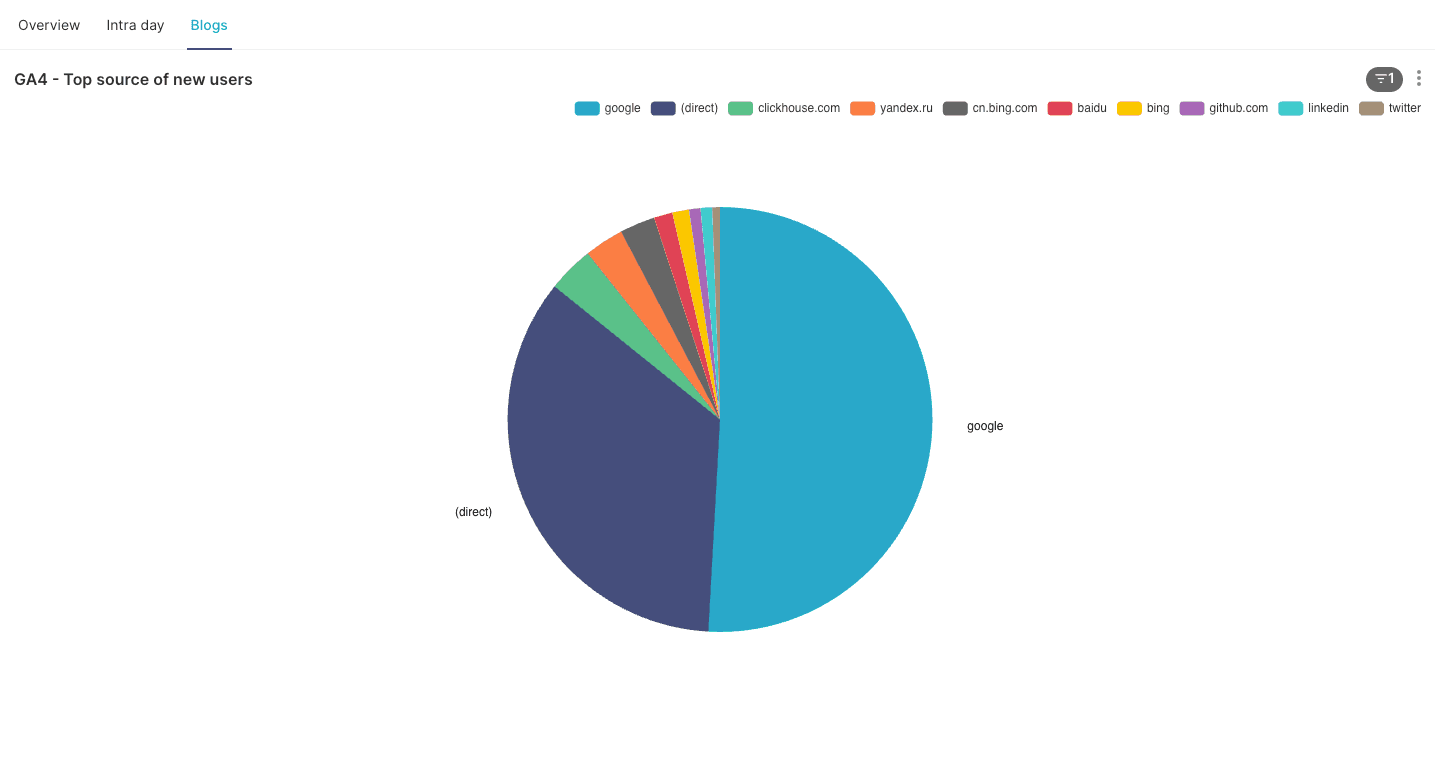
Top traffic sources
What’s Next
Our remaining work mainly revolves around ensuring datasets are available in our internal data warehouse that we can use to enrich our analytics. For example, many pages are categorized with a theme such that we can perform usage analysis based on this data. This data is very small and mostly used for lookups at query time. We plan to manage this data through dictionaries once we can expose it elegantly via our CMS.
Dictionaries provide us with an in-memory key-value pair representation of our data, optimized for low latent lookup queries. We can utilize this structure to improve the performance of queries in general, with JOINs particularly benefiting where one side of the JOIN represents a lookup table that fits into memory. More details here.
Finally, appreciating that not everybody is comfortable with SQL and in the spirit of everything needing to be generative AI to be cool and worth doing, I decided to spin off a side project to see if we can answer Google Analytics questions via natural language. Imagine a world where you can simply type “Show me new users for pages about X over time for the last year,” and you were magically presented with a chart. Yes, ambitious. Possibly a fairy tale. Stay tuned.
Conclusion
We have presented an easy means of enhancing Google Analytics data with ClickHouse to deliver flexible, fast analytics with infinite retention for less than $20 a month.